

Summary
Key Takeaways:
Sugar broke to fresh highs (16.74c/lb, 11 Aug) after UNICA showed Brazil Center-South June output down 26.3% y/y, sparking a short squeeze above the March YTD high.
Texas cotton conditions keep deteriorating (good/excellent 24%, poor/very poor 34%), lifting 2026/27 supply risk even as USDA's larger balance sheet caps near-term upside.
Coffee remains range-bound (Arabica 310–360c, Robusta $3,700–4,100/t) awaiting a fresh catalyst, with Brazil's harvest running behind pace at 64% complete.
Sugar managed money net short fell sharply (-34,599 to 77,814 contracts) as stop-losses were triggered on the UNICA-driven rally.
Cotton managed money net longs grew to the 91st percentile, leaving positioning crowded and vulnerable to liquidation on any reversal.
India's monsoon deficit persists (12% below LPA) with flood risk now building in key cane belts, a wildcard for sugar supply.
US payrolls weakened sharply (July -23k, prior months revised down 103k), yet yields stayed elevated as firmer oil keeps inflation risk in focus.
Charts - Price Levels & Structure
If you want to understand our technical charts further, you can read about how to interpret them here.
LAST CALL: Your final week of free GSX Research - Subscriptions are now live!
From next Monday (17th Aug), GSX market insights - Price Action, CFTC positioning breakdowns, trade flows, options analysis, curve structure calls, macroeconomics, and much more - move fully behind the paywall.
Don't miss an issue → subscribe today
Launch Offer - ends 1 September!
Lock in founding subscriber pricing before it's gone → claim your rate

Cotton
Cotton remains a weather-driven market, and conditions in Texas deteriorated further this week without producing a decisive breakout. U.S. squaring reached 93% and boll setting 65%, both near average. National good/excellent fell to 40% from 42%, and poor/very poor rose to 22%.
Texas remains the key risk: good/excellent dropped to 24% from 28%, while poor/very poor rose to 34% from 30%. December cotton settled at 84.37 c/lb on 11 Aug.
USDA’s balance sheet continues to limit the upside, with U.S. production projected at 13.7m bales and ending stocks at 4.1m bales, or 29.5% of use. Export demand has slowed down, current-crop upland sales fell to a MY low of 55,900 RB, though new-crop reached 250,400 RB.
Coffee
Brazil’s harvest reached 64%, still behind 77% last year and the five-year average of 70%. September arabica settled at 335.75c/lb, while robusta closed at US$3,782/t.
Large crop estimates remain bearish: 66.7m–75.4m bags. However, ICE arabica stocks have fallen to around 242,673 bags, keeping squeeze risk elevated. Robusta certs are are steady near 701k bags versus 1.18m a year ago.
Global Macro
The U.S. economy is looking softer, but inflation risks have not gone away. The July jobs report was weak, with payrolls falling by 23,000, while May and June were revised down by a combined 103,000.
Even after the weaker jobs report, yields have stayed high because stronger oil prices are bringing inflation risk back. U.S. 10-year yields are around 4.7%, U.K. 10-year gilts have pushed above 5.0%, and German bunds are around 3.2%.
Interest rates are still doing a lot of work in the background. The Fed funds rate is 3.50%-3.75%. In Australia, the RBA left the cash rate at 4.35%, but kept the door open to another hike if inflation stays sticky.
The primary risks for inflation across the G7 is elevated crude and oil products and the global build out of data centres who have plentiful amounts of money to burn and are price elastic and can pay any price necessary. The former is likely to ease in the coming months but the latter is going to be an ongoing problem for central banks as the data centre build out continues.
Energy is another pressure point. Brent crude is around US$90/bbl and WTI around US$83/bbl, on the entire G7, what should not be discounted is that U.S. does not have the military capability to simply keep firing missiles at dinghy boats in the strait of hormuz, if they can’t simply continue an Air War. They tried this in the late 1960s and early 1970s in Vietnam to bomb the North into oblivion, wars are not won from air power alone. Can crude go up, yes however the options are
1. Declare defeat, agree to a tenable peace
2. Put boots on the ground
3. Neither are very palatable, however it would seem that the Iranians hold all the cards…..
The midterms are approaching in the U.S. It would appear that Trump has the Republicans firmly under his thumb and the Democrats are swaying to the left as seen by the near weekly primary losses to socialist Democrats. It is one thing to win a primary where you only face your party members, the membership does not represent the electorial base and the Democrats are digging themselves into a hole by going to the left rather than the centre. As we begin to get closer to November the market will begin to closely watch what the outcome will be. Trump would be acutely aware of this and would like to get out of this war to improve his chances at the midterms, history is not on his side, sitting presidents rarely win midterms and to be fair it is not likely he really cares if he wins or loses, as it is inconsequential since he will not face another election.
This is important to keep all this in mind as BACA (Buy American Cotton Act) should be in front of everyone’s mind as, how can they really pass this bill? While some are saying this is bipartisan, if you were to take a electoral map of where cotton is grown and Republican districts you would see that all of the land sits in Republican districts…..
In saying that, there is the chance that BACA is rammed through in a reconciliation bill in Sept or Oct which would be the last opportunity to pass anything major before a potential electoral wipeout.

Cotton
Cotton Price Action
The curve is increasingly pricing a 2026/27 U.S. production problem. N7/Z7 is trading near +800 points, while Z6/H7 is approaching -200 points, signalling that the market sees ample cotton in the near term but is becoming increasingly concerned about supply before the 2027 harvest. The key risk is Southwest abandonment after four weeks of limited precipitation, extreme heat and little meaningful rainfall in the High Plains forecast.

The comparison with 2022 is becoming more relevant. Texas cotton is now only 24% good/excellent, while Oklahoma is at just 8%, with topsoil moisture rated 77% short/very short in Texas and 71% in Oklahoma. However, subsoil moisture remains materially better than in 2022. Texas is currently 64% short/very short, compared with 87% at the same point in 2022, while Oklahoma is at 72%, versus 82% previously. This should provide some protection to irrigated and better-established crops, meaning a repeat of 60%+ abandonment across Texas and Oklahoma is possible but wouldn’t be our base case.

The market has already priced a meaningful Southwest production loss. Further upside will likely require USDA to confirm a sharp reduction in harvested acreage, or evidence that the damage is spreading beyond dryland abandonment into materially lower irrigated yields. Better subsoil moisture should prevent an exact repeat of 2022, but without widespread rainfall soon, the gap between the two seasons will continue to narrow.
Charts - Price Levels & Structure
Strategic
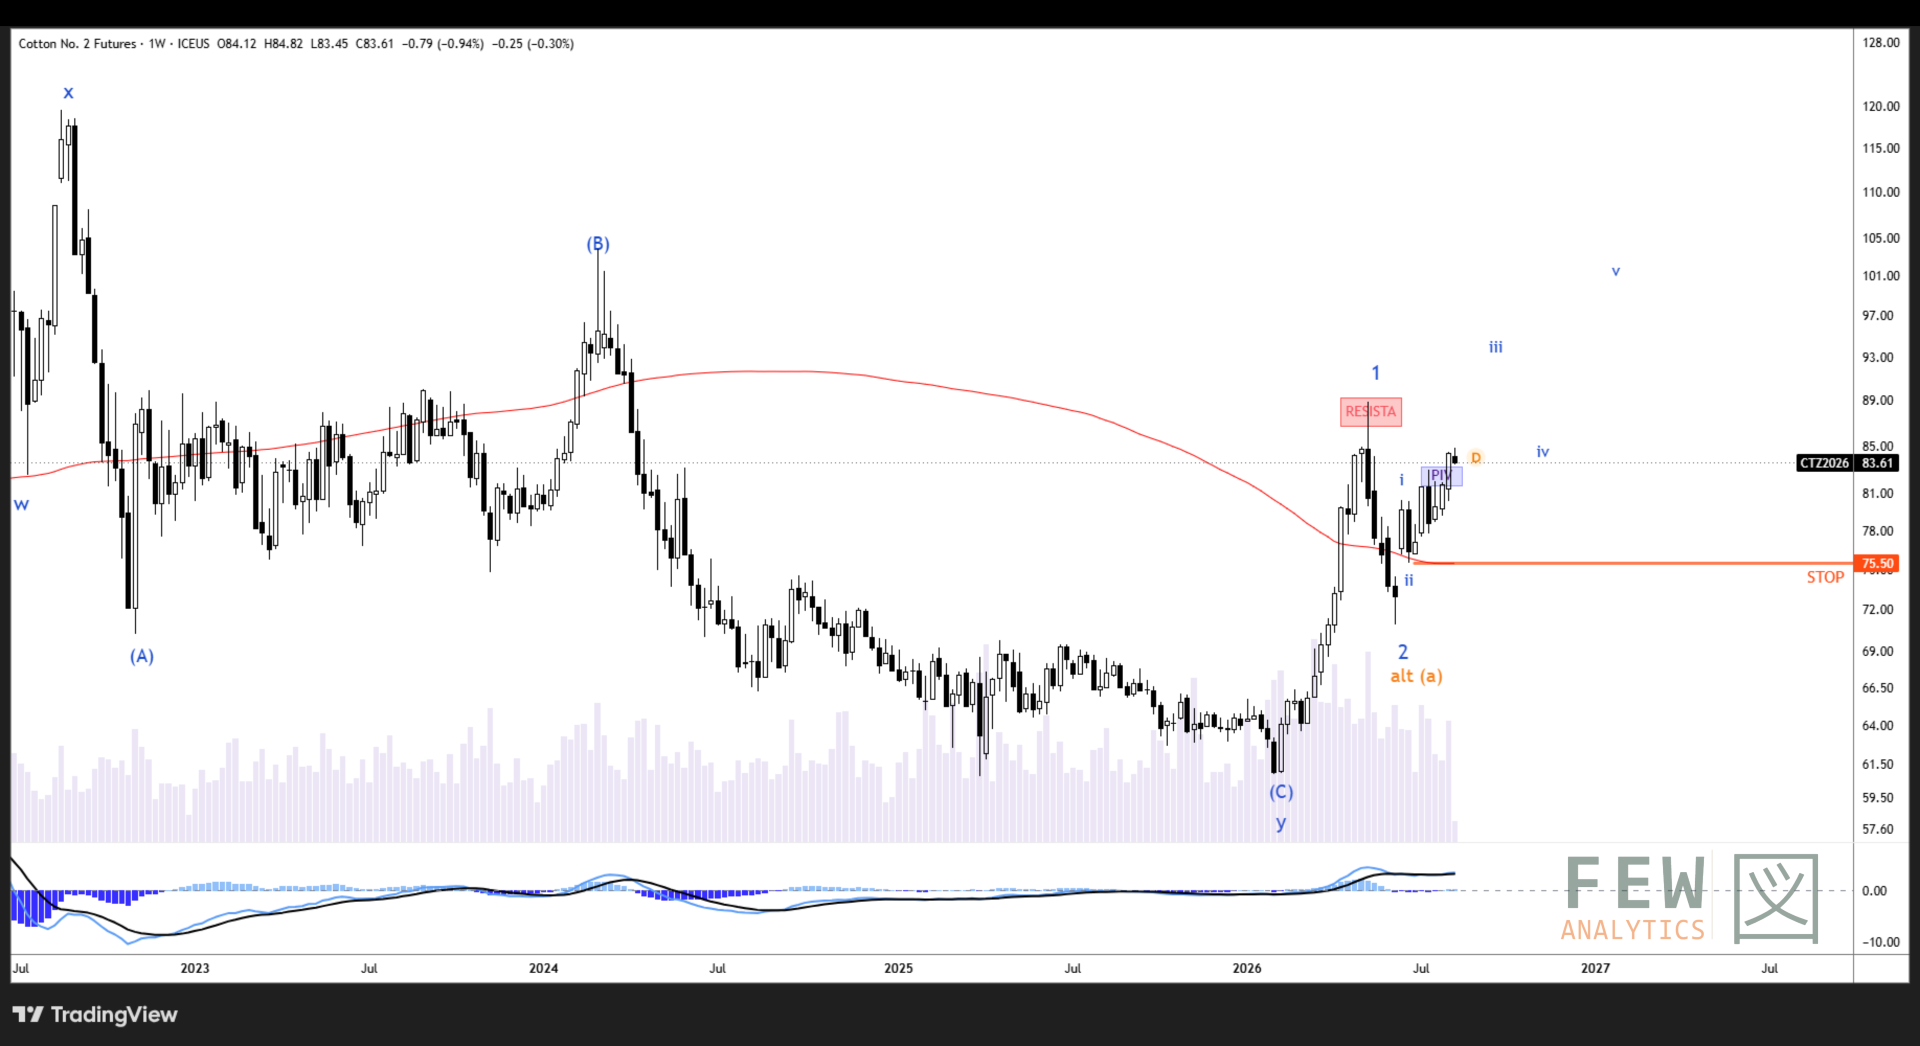
Cotton has deigned to finally break above the pivot that contained price for three weeks. That level had been the single constraint on this market since mid-July, and clearing it was the trigger we flagged in each of the last three editions. This was looking a respectable start to the heart of wave iii, a move that takes us to new 2026 highs. However this week's candle is not constructive thus far. A breakout that fails to hold is worse than no breakout at all, because it hands the initiative straight back to sellers and puts the whole structure back under question. So we're watching closely to see how this weekly candle closes. Bulls would prefer to see it surpass the previous week's close of 84.40. Anything short of that
and the break starts to look like a fake, rather than a reliably trending market.
Click to Zoom
Tactical
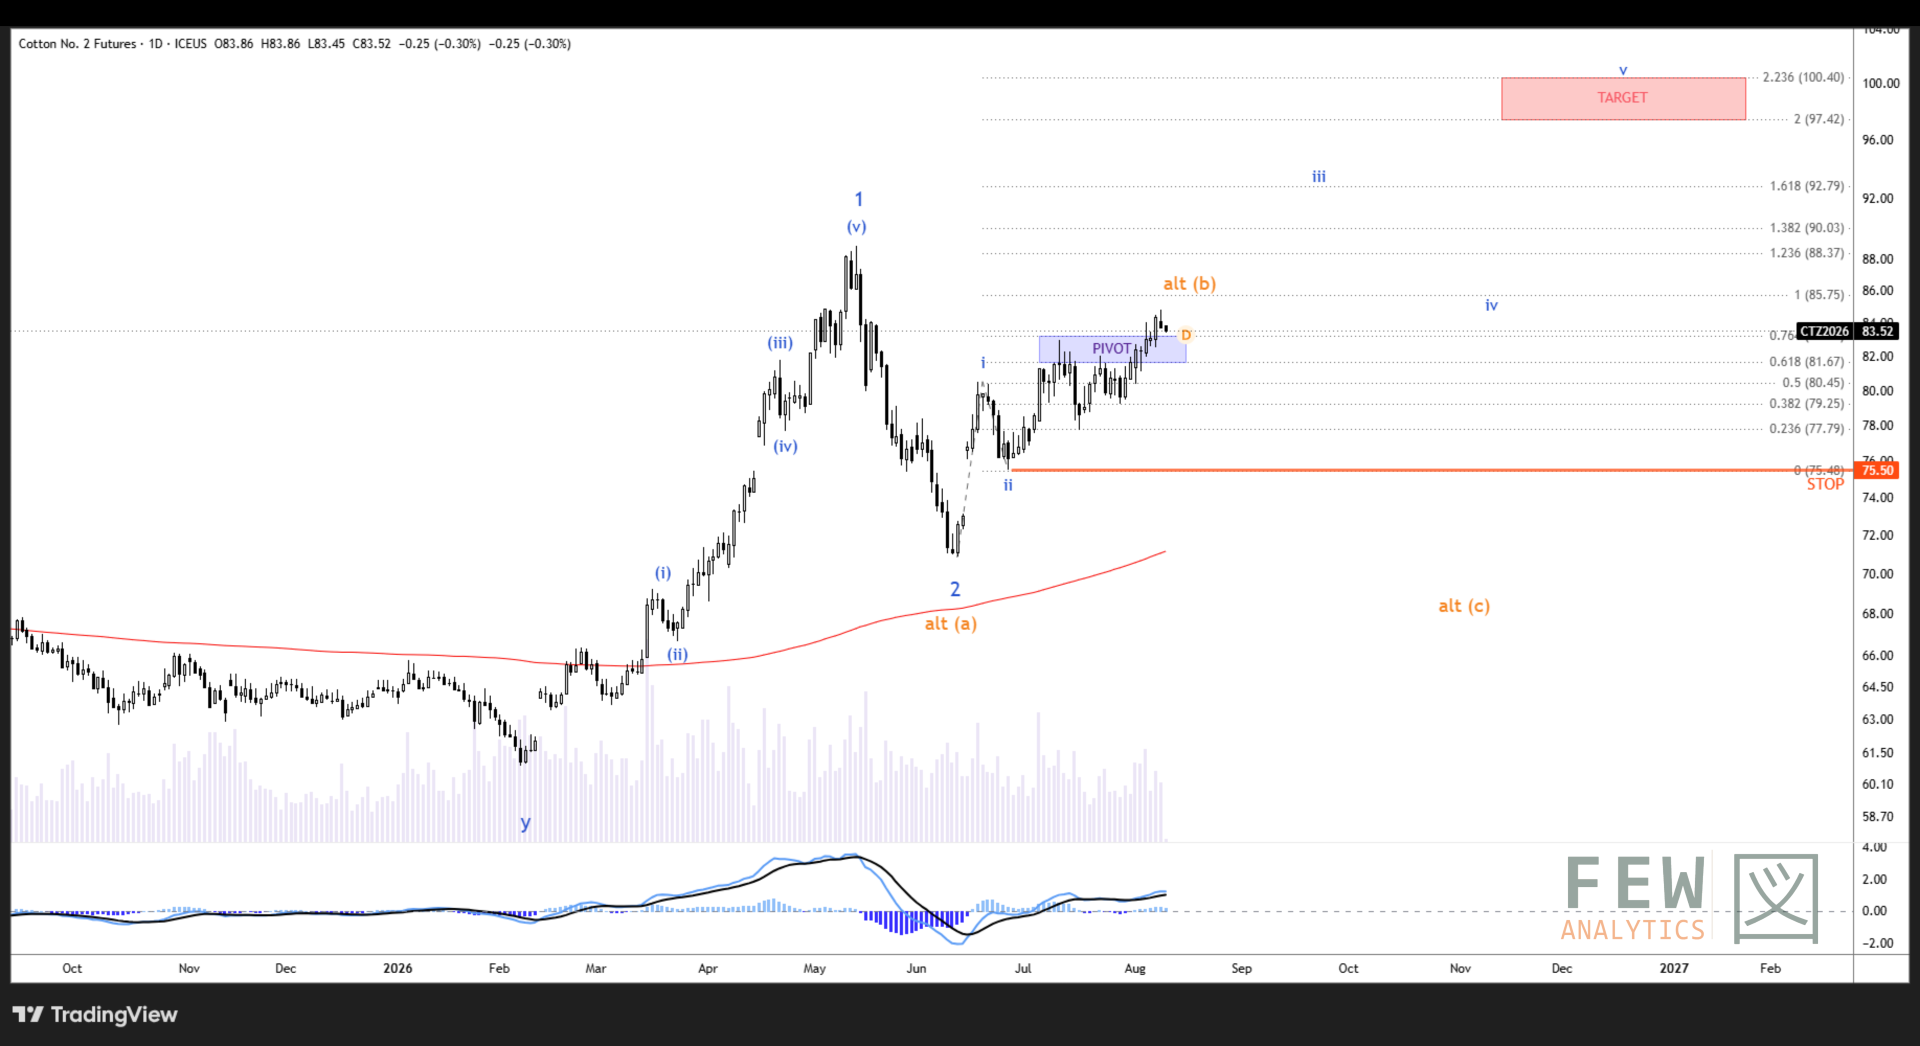
CT futures made a move above the key 83 level during the week, in what we are counting as wave iii. Market is bullish so long as we are above the 0.618 extension residing at 81.00 area. Adding an alternate bearish path here for prudence, should this move not continue trending towards the 92
interim target. That would make this (b) wave up, the (c) to come. Expect whipsaw on the charts this week as key US CPI data print is on deck for Wednesday.
Click to Zoom
Cotton Positioning
CFTC data for the 4 August showed heavy spread activity, with open interest rising by 18,404 contracts to 473,629, situating at the 99th percentile of its 20-year range. However, spreads grew by 9,192, therefore directional open interest grew by 9,212 contracts in newly established positions.
Managed money accounts net long grew by 9,869 contracts as they turned more bullish, shown by a mix of additional longs of 7,566, and short covering of 2,303. Their long position is at the 91st percentile, prone to long liquidation if price were to go against their positions - net long is also crowded at 82nd percentile.
Commercials extended their net short position by 9,606 contracts to 136,621 - primarily additional shorts of 8,971, with long liquidation of 635. They were the primary counterparty to managed moneys buying.
Other Reportable net long position fell for a third consecutive week, down 5,829 contracts to 40,214. Meanwhile, swap dealer net long grew for the third consecutive week to 24,574 contracts. Other Reportable net remains at the 98th percentile, down from the 99th prior week, and prone to long liquidation.


Balance sheet
The 10 July WASDE remains the latest official read. For 2025/26, exports remain 12.20m bales, ending stocks 4.20m and the farm price 62.5c/lb. For 2026/27, production is 13.70m, ending stocks 4.10m, stocks-to-use 29.5% and the price forecast 73.0c/lb. The key assumptions remain 7.54m harvested acres and 872 lb/acre; Texas must underperform those assumptions to tighten the U.S. sheet.
Globally, production of 117.26m bales remains 4.69m below consumption of 121.95m, with ending stocks at 71.22m. The world balance is supportive, but the U.S. balance remains burdensome. The next major production update is 12 August.
Planting has progressed into squaring
Squaring reached 93% nationally, up from 88% and just above the five-year average. Texas reached 90%, up from 82%, but remains a point behind average.
Boll setting advanced to 65% nationally and 55% in Texas, both only one point off last years pace. Development remains broadly on schedule.

Condition Report
Crop ratings worsened for a third reporting week. U.S. cotton fell to 40% good/excellent, from 42% (46% three weeks ago), while poor/very poor rose to 22%, from 20%.
Texas recorded the lower levels: good/excellent decreased for the third week to 24%, from 28% (and then from 34%), while poor/very poor rose to 34%, from 30%. This reflects sharper deterioration than the national trend, and Texas conditions remain weak enough to keep yield risk alive.

US Cotton Export & Sales
For the week ended 30 July, current-crop upland sales reductions totaled 55,900 RB, marking a marketing-year low, while new-crop sales reached a remarkable 250,400 RB for the new 2026-27 marketing year. Upland shipments fell 5% to 222,800 RB. On a 480-lb statistical-bale basis, all-cotton shipments were approximately 234,700 bales, lifting cumulative exports to 11.925m.

Total commitments increased to 12.847m bales, 647,000 above USDA’s 12.20m export forecast, but the shipment target is now out of reach. With 921,500 bales still to ship and the marketing year about to close 31 July 2026 - exports look set to finish near 11.93m, roughly 270,000 short of forecast.

At the current pace, approximately 0.92m bales of unshipped old-crop sales are likely to roll into 2026/27. Combined with 3.328m already booked for new crop, opening commitments would be near 4.25m bales, or 35% of USDA’s 12.30m forecast. Our base case is a 250,000-bale August WASDE export cut to 11.95m, lifting new-crop beginning stocks to 4.45m and ending stocks to 4.35m. The adjustment is mildly bearish, although the August production revision remains the larger balance-sheet risk.

Soil moisture deteriorated alongside the ratings. Texas topsoil rated short or very short increased to 77%, from 71%, while subsoil short or very short rose to 64%, from 51%.
National topsoil short or very short increased to 50%, from 48%, while subsoil rose to 50%, from 48%. This is the week’s clearest supportive weather signal and limits the comfort from better condition ratings.

The latest Drought Monitor continues to increase for the third consecutive week for Texas. D1–D4 drought increased to 25.2%, from 23.2%, and D2–D4 also increased to 10.1%, from 9.5%, for a third consecutive week as well.
The broad drought picture continues to deteriorate, but the map is valid through 4 August and therefore predates some of the deterioration captured in the latest soil-moisture report.

For 16-20 August, CPC favors 70-80% probability above-normal temperatures across all Texas regions. Precipitation is leaning to below-normal median in North and West Texas and below median in South-East Texas.
Both the forecast and observed day 1-5 QPF maps show rainfall increasing across the Northern and North-eastern states, but over both periods, Texas is largely bypassed.
Forecast below: 11 - 16 Aug

Observed below: 4 - 9 Aug

Cotton On-Call
No major outlier in the latest Cotton On-Call report: A decrease of 160 contracts in the unfixed call sales and still heavy concentration in the unfixed call purchases with 38,938 contracts in the new-crop December 2026 contract.

Outlook for Cotton
Bull Case
Texas stress: good/excellent deteriorated to 24%, with topsoil short/very short at 77%.
Commitments remain strong: 12.905m bales, about 705k above USDA’s export target.
Rain outlook is mixed: missed West Texas showers would keep abandonment risk elevated.
Bear Case
USDA raised supply: U.S. production increased to 13.7m bales and ending stocks to 4.1m.
Rain remains the key cap: verified High Plains coverage would quickly reduce the weather premium.
Demand is still soft: sales fell, and remain below recent averages; on-call positioning is not clearly bullish.
Base Case
Crop progress: U.S. 93% squared / 65% setting bolls; Texas 90% / 55%.
December near 84.37c: support 80.0/79.3c; resistance 81.5/83.0c.
Bias: neutral-to-firm. Constructive above 79.3–80.0c; bullish above 83c; bearish if rain verifies and December breaks 79.3c.
Coffee
Coffee Price Action
KC continues to trade off technical levels and has been driven fundamentally by weather forcasts from Brazil and by export numbers from Cecafe in Brazil. The range the market has established is 310 to 360, the market needs a fundamental catalyst to be able to break above or below this range. The market neared that ceiling but reverted to the mid-range settled Sept 26 on 11 Aug, 335.75c/lb.
Arabica Dec 26 settled on Tuesday, at 315.70c/lb, leaving the U/Z spread at +20.05 c/lb, rose from +14.25 c/lb the prior week. Sep and Dec are the most active with Sep open interest at 38,498 and Dec at 78,668 lots.

The farmers have enjoyed the market rally into peak harvest, as they are in no hurry to sell aggressively until the market finds new highs. The Brazil weather forecast for the last week has played out in favour of the farmers and continues as dry weather is on the radar, fueling more optisimism in regard to the progress of the harvest.
Robusta has similarly held a range of 3700 - 4100 $/t, since its low in May. Cert stocks remain historically tight at 701k bags, down from 1.18m a year ago, but have turned up 15% off their early-June low. Managed money has length in the Robusta futures, however, has reduced from 33% to 29% of the total open interest.
Charts - Price Levels & Structure
Strategic
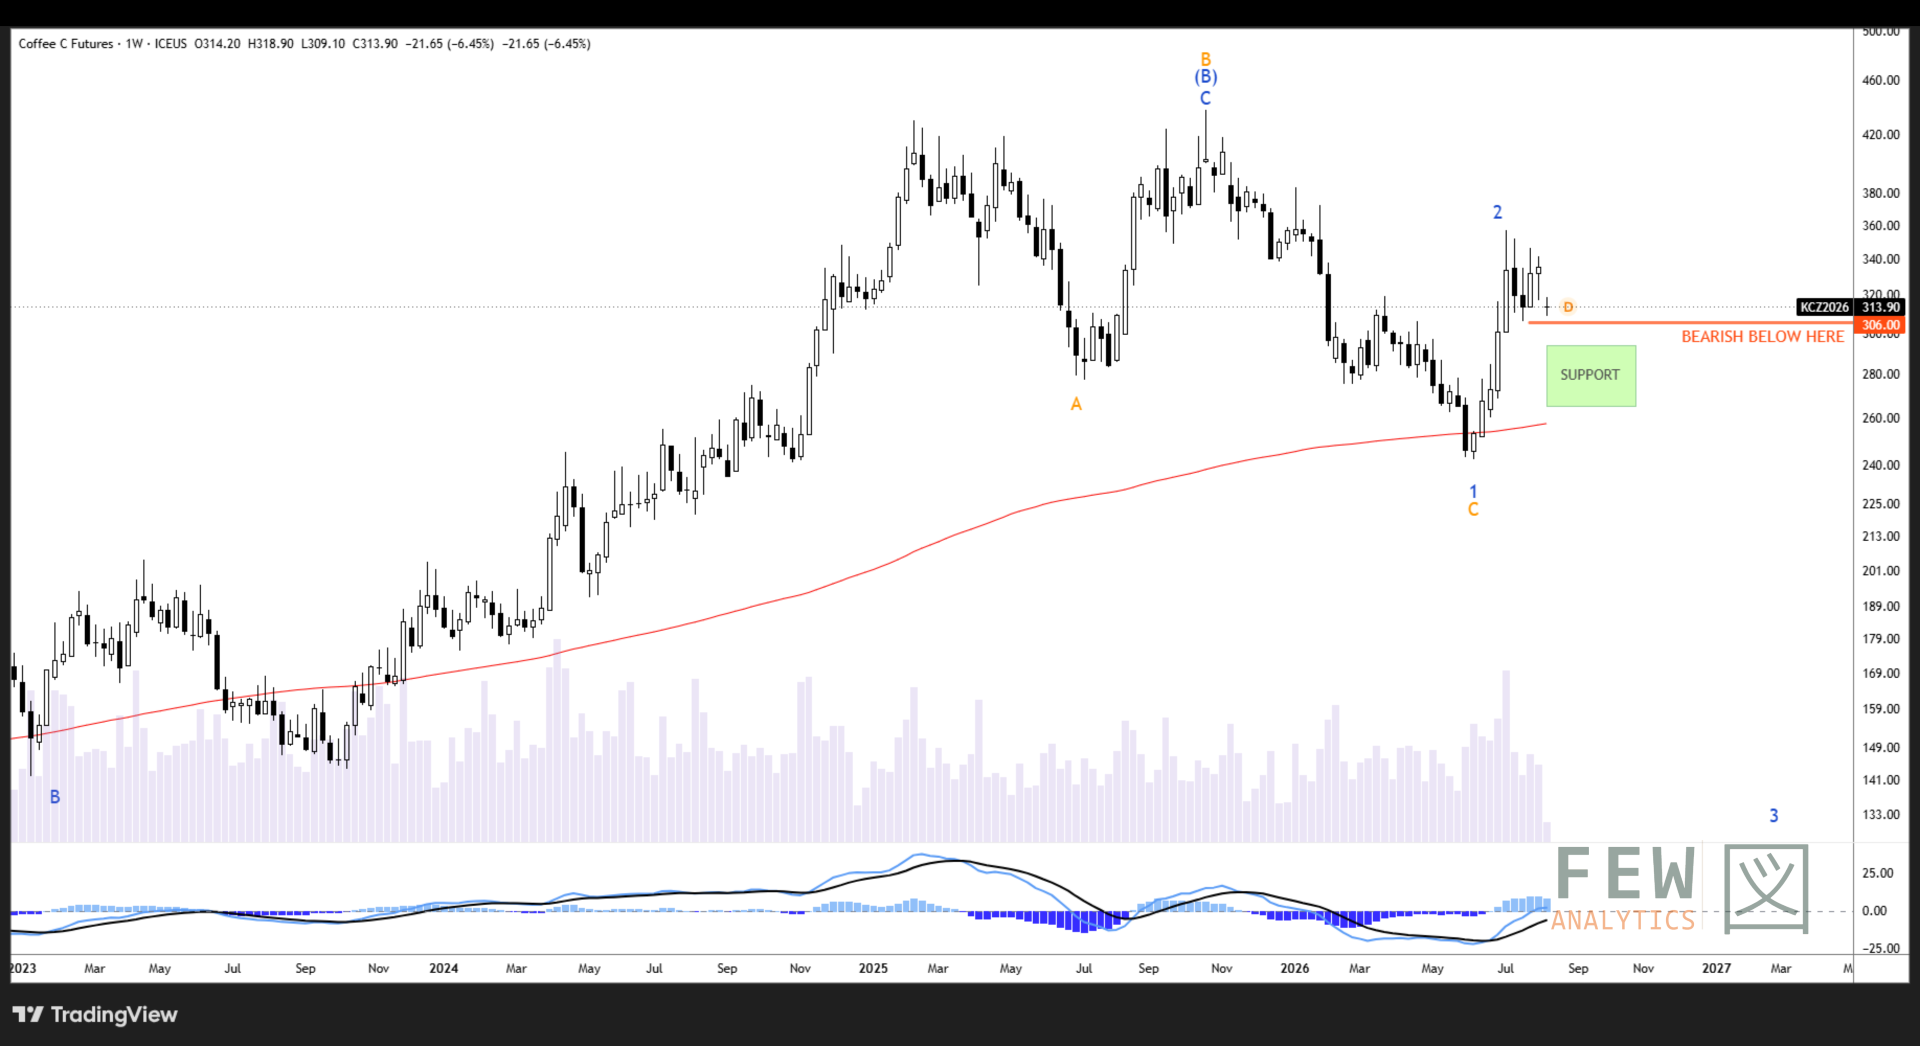
What a difference one week can make in markets. Last week, the bearish base case was being strongly challenged by some upside to 340. Since then, we saw a sharp downward move that reduced the probability of an immediate bullish trend, and we extend chop between the 300 and 350 band. This highlights the power of Elliott Wave analysis: often, a base case is pushed to the edge of validity, only to suddenly come back with strength. Bullish scenario is not dead yet, more in the tactical notes.
Click to Zoom
Tactical
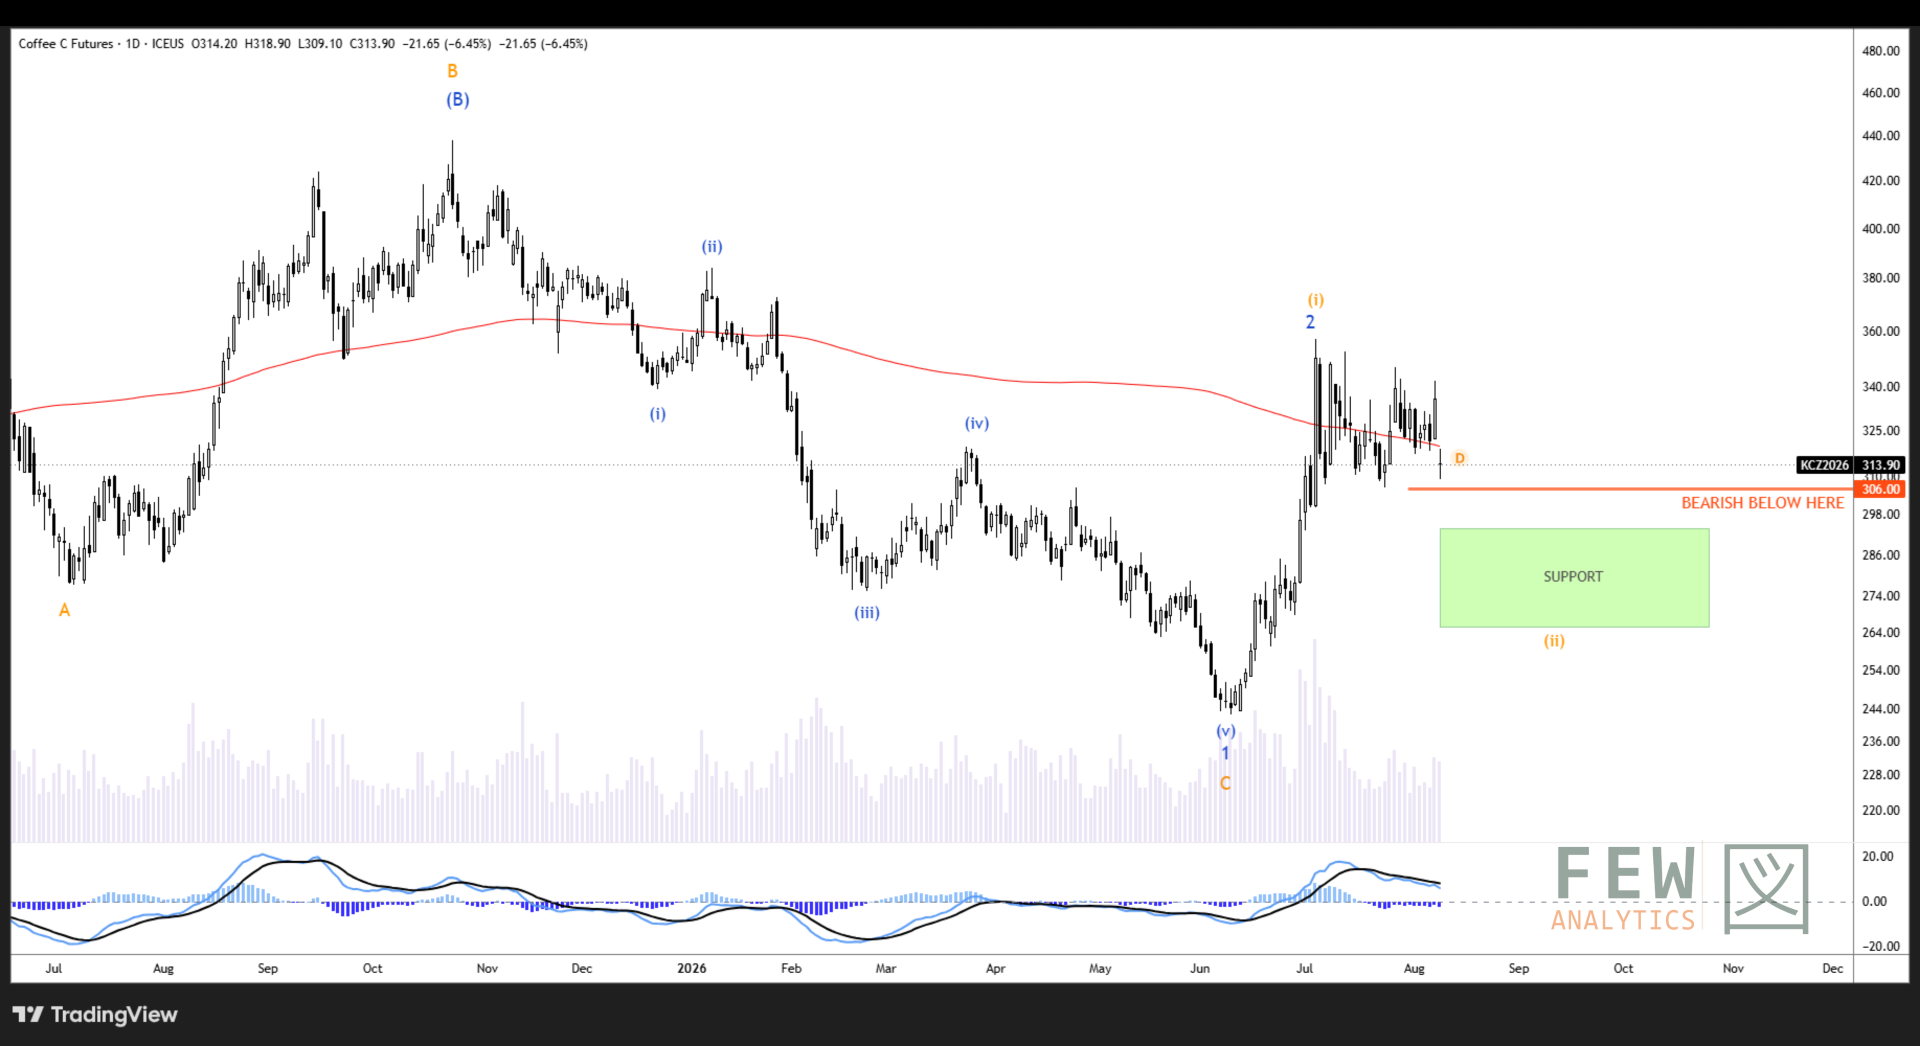
KC was again unable to break key levels outlined, 347 or 306, since last week. Ongoing action since early July has been choppy and overlapping, offering few directional cues. In the short term downside is likely under both cases, at least into the green support box added. We have the US CPI catalyst upcoming, so it will be interesting to see if that event can break KC out of this range. 280 is the ideal support to keep the bullish alternate case alive.
Click to Zoom
Physical Pricing
Fine Cup stands at 10 over Dec ‘26
Good Cup stands 27 under Dec ‘26
Grinders stands 68 under Dec ‘26
Conilon stands 3 over Nov ‘26

Certified stocks: Arabica at 242,673 bags as it continues to drop ~285,398 bags in the last 4 months, a 54.1% decrease, while Robusta remains steady currently around ~701k bags
Stock stored is heavily skewed in Antwerp, reduced WoW distribution from 176,703 to 167,176 bags.


The spreads U/Z are at record highs compared to the last 10 years. What is driving this is primarily certs being close to record lows. Will there be deliveries against U? Options expiry is on Thursday and FND is the 21st of Aug, so there could be some funny games played, OI is steadily rolling off so this will certainly be a volatile period for the spreads and the rest of the curve is likely to be taken along for the ride.
The board is mostly composed of Hondos, Peru and Uganda and there have been whispers of a mysterious strong, powerful and beautiful charter down there in the beautiful blue seas in the “Gulf of America” that are here to save the board…..
Bottom line:
Given the current rules on certification, decertification, and the stretched and volatile market we have seen, we are likely to see a concerted effort to influence the board……
Coffee Positioning
CFTC report for 4 August showed Arabica’s managed money net long position fell by 1,586 to 23,550 contracts. Driven by long liquidation of 1,038 contracts, compounded by additional shorts 548 contracts - as the price moves within a range of 310-350 c/lb, and no clear direction.
Robusta’s managed money net long position fell by 1,591 contracts to 37,968 - for the third consecutive reporting week. Primarily from long liquidation of 1,826 contracts, partially offset by short covering of 235 contracts. Managed money long position is crowded at the 94th percentile, and its net long position sits at the 95th percentile( both reduced by 1 percentile from the prior week). This leaves little room for additional long positions and is prone to liquidation if price were to drop on a fundamental shock.
Robusta commercials net short position fell by 1,241 to 41,829, driven by short covering of 2,396, with some long liquidation of 1,155. Net short position at the 5th percentile (increased from 4th prior week) provides a cushion for managed money liquidation.


Interestingly, the 5year positioning charts show Arabica managed money net and long holding in a narrow band, consistent with the percentiles and lack of price direction. By contrast, Robusta has pushed into territory rarely occupied before, even as recent price action has been less volatile.


Outlook for Coffee
Bull Case
ICE arabica stocks fell to 242,673 bags, a 2.25-year low; Sep/Dec backwardation widened to +20.05 c/lb.
Brazil’s harvest is only 64% complete versus 77% last year, with rain delays and cherry drop threatening prompt quality and availability.
Bear Case
Sep settled at 335.75c, down 1.44% Tuesday and 33.95c below the 357c spike; two ICE margin hikes which have been reverted, however thin liquidity favours sharp reversals.
Brazil’s record crop remains the ceiling: USDA 71.9m bags; private estimates 66.7–75.4m bags.
Robusta is weak confirmation: stocks recovered to 4,237 lots, Vietnam H1 exports rose 7.3% to 1.05 MMT, and funds hold 37,968 net-long contracts.
Base Case
Tight nearby, looser forward—but now a high-volatility range rather than a clean breakout.
Sep near 335.75c: support 320–315c, then 310–300c; resistance 340–352c, then 357c.
Bias: fade rallies into 340–350c, but avoid chasing shorts below 315c while stocks remain under 300k bags and U/Z holds near +15.3c.
Sugar
Sugar Price Action
No.11 surfed the wave last Friday, Aug 7th, deliverying the catalyst or supply shock we flagged last week as necessary for a move higher. The release of the widely anticipated UNICA report, which was delayed for roughly 2 months had been published…and the numbers were the shock. Price traded to a high of 16.50 c/lb before closing the day at 16.49 c/lb. It revealed a drop in accumulated sugar production averaged across Brazil nationally of 12.97%. More specifically, the staggering decline in June, Brazil Center-South sugar production fell 26.3% y/y to 3.903 MMT. This was the catalyst, and price triggered the short positions and their stop losses. This created a short squeeze and the rally in the market.
Price settled 16.74c/lb, on 11 Aug and has now broken above the YTD high set in late Mar (16.64). This YTD high had itself formed primarily from the US-Iran conflict, and Tuesdays close puts sugar into fresh territory off the backend of a supply shock. This gives us two separate catalysts being Iran in March and UNICA in August, pushing into successive higher highs. The price remains in that range discussed previously, the consensus from various sources is that they have reduced global productions forecasts for 2026/27. With price now trading above the old Mar ceiling of 16.64, that level becomes the real test of whether this UNICA-driven move has established a new price floor. If a price moves back down, we would be able to confirm it was a short squeeze rather than a structural change. Weather scares have remained at bay, US-Iran conflict continues and the USD/BRL remains steady at 5.1573 moving only +0.95% over the month. The FX is not currently changing the ethanol parity picture, so the rally is purely supply side rather than currency driven. If base case is true we could see price settle until a new catalyst drives price to a new high.
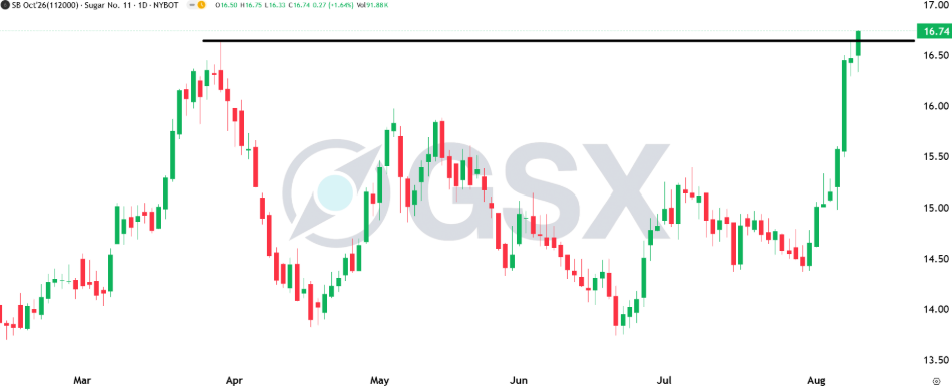
Click to Zoom
Price Move - Volatility Breakdown
Friday 07/08 close: The recent price spike saw ATM IV at 26.80%, compared to its 3 month average of 24.61% and its 10year average of 25.49% - the IV position is not very high in historical terms. The IV (26.80%) sits 2.73 points below RV20 (29.53%): Options have not fully priced in the volatility and a view that the IV needs to play catch up, implying more sustained volatiltiy. A bet on this would be to go long vol and expect the vol to be turbulent in the near-future.


Weather
The three major producing countries have recently had weather shocks that have had effects on crops and ultimately the price. India is the standout with the Monsoon still forecast for the worst in 11 years, June deficit of 40%, followed by July surplus of 1% above normal - which leaves the cumulative season at 478 mm compared to LPA of 544 mm, a 12% deficit till 11 Aug. Core cane belt is to experience heavy rainfall, specifically Maharashtra and Karnataka - raising risk of floods to key sugarcane producing regions.
Thailand is forecast to receive heavy rainfall and risks of flash floods for the next two weeks from the Monsoon Trough. Brazil has endured heavy rainfall that delayed harvest but a reprieve for dryer weather is on the radar.

Sugar Positioning
CFTC data for 4 August showed open interest rise by 48,969 contracts to 1,252,623 - directional open interest grew by 15,226 as the spreads grew by 33,743. Open interest rose to the 93rd percentile from the 89th the prior week, placing participation toward the upper end.
Managed money long position rose by 15,186 to 196,995, and the short position fell by 19,413 to 274,809, at the 94th percentile (fell 2 percentiles from the prior week). The net short position fell by 34,599 to 77,814, though it still sits at just the 14th percentile. The market still has fuel to move higher, MM short remains historically crowded (94th percentile) even as it unwinds, while net positioning (14th percentile) still has significant room to rebuild before reaching typical long extremes.
Other Reportable net long position fell by 7,649 to 23,085, primarily from additional shorts (8,348), with some additional longs (699).
Commercials net short rose by 21,198 to 136,295 contracts, driven by additional shorts (18,305) and long liquidation (2,893). Swap dealer net long fell 11,801 to 179,752, from additional shorts (9,432), and by long liquidation (2,369).


UNICA Report
UNICA released its delayed report on Friday 7th, Aug which was the catalyst to the price jump, as mentioned earlier. The cumulative cane crushed till 01/07 for the current year was 214.47 MT, up +3.82% for South-Central and +1.86% for Sao Paulo.


