

Summary
Key Takeaways:
Cotton remains weather-driven, with worsening Texas conditions supporting prices but not yet tightening the balance sheet.
Weak export sales and higher USDA stocks continue to limit cotton’s upside.
Coffee is consolidating, with arabica trading broadly between 310–355c/lb.
Low ICE arabica stocks and Brazil harvest delays are supporting the nearby coffee market.
Large Brazilian crop estimates remain the key bearish risk for coffee prices.
Technical Analysis
Read this week’s Technical Analysis here. If you want to understand the charts further, you can read about how to interpret them here.
Cotton
Cotton remains a weather-driven market, but deteriorating conditions in Texas have not yet produced a decisive breakout. U.S. squaring reached 73% and boll setting 32%, both near average. National good/excellent improved to 45%, although poor/very poor rose to 18%.
Texas remains the key risk: good/excellent held at just 30%, while poor/very poor rose to 28% from 24%. December cotton settled at 80.42c/lb on 21 July.
USDA’s balance sheet continues to limit the upside, with U.S. production projected at 13.7m bales and ending stocks at 4.1m bales, or 29.5% of use. Export demand also weakened sharply, with sales falling to 34,400 RB, down 48% week on week.
Coffee
Brazil’s harvest reached 64%, still behind 77% last year and the five-year average of 70%. September arabica settled at 322.10c/lb, while robusta closed at US$3,818/t.
Large crop estimates remain bearish: 66.7m–75.4m bags. However, ICE arabica stocks have fallen to around 330,000 bags, keeping squeeze risk elevated. Potential El Niño-related losses of 15%–20% remain a risk scenario, not a confirmed outcome.
Global Macro
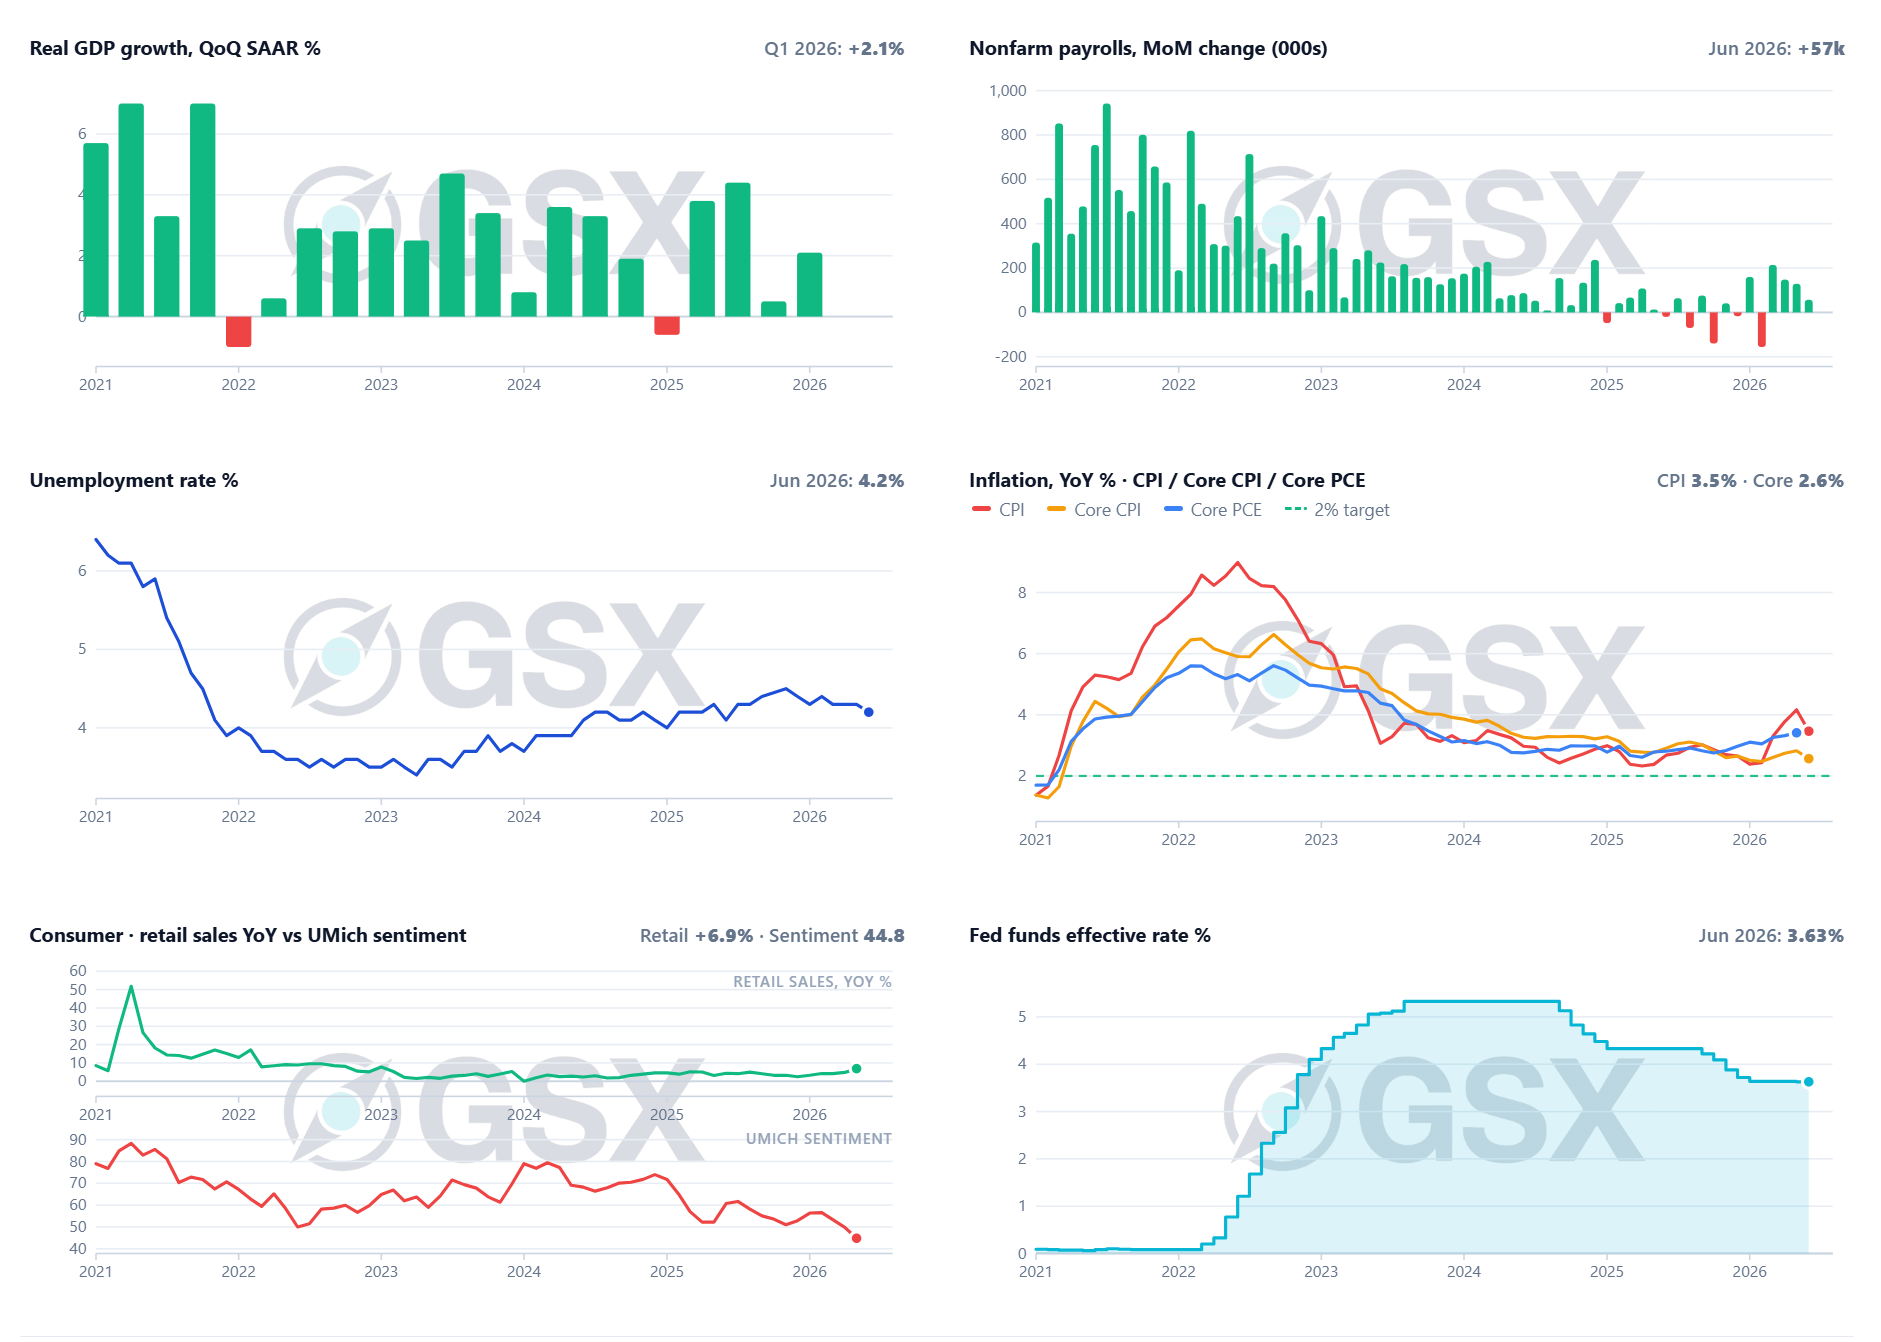
U.S. inflation softened, with headline CPI down 0.4% month on month and annual inflation easing to 3.5%. However, the 10-year Treasury yield rose to 4.63%, the dollar index strengthened to 101.16, and September Fed hike odds climbed to 68.2%.
Brent reached US$91.01/bbl, supporting cotton through higher polyester costs but increasing inflation risk. China remains the key demand concern, with second-quarter GDP slowing to 4.3%, retail sales rising only 1.3%, and property investment falling 18.0%.
The war in Iran continues to escalate, with both sides refusing to backdown and it appears that this war still has a way to go in order to be resolved.


Cotton
Cotton Price Action
ICE Cotton dropped early in the week ending Tuesday 21 July, low of 77.73 before Dec settled 80.42 c/lb. Oct 26 settled 78.96, Mar 27 settled 81.74, and May 27 at 82.63. Against the 21 July closes that leaves Dec up 150 points and March up 145, a hold rather than a fresh leg after the prior week's 400-plus-point run.
The July WASDE was mildly bearish, raising 2026/27 production to 13.70 million bales and ending stocks to 4.10 million, a 29.5% stocks-to-use ratio.
Cash firmed. The seven-market spot average rose 99 points to 73.97 c/lb for the week ending 16 July. Transactions stayed thin at 604 bales. Crop ratings eased to 45% good/excellent from 44%, with 73% squaring and 32% setting bolls. Record heat across West Texas is the bullish lever, and certified stocks fell to 98,838 bales.
Technical Analysis
Strategic
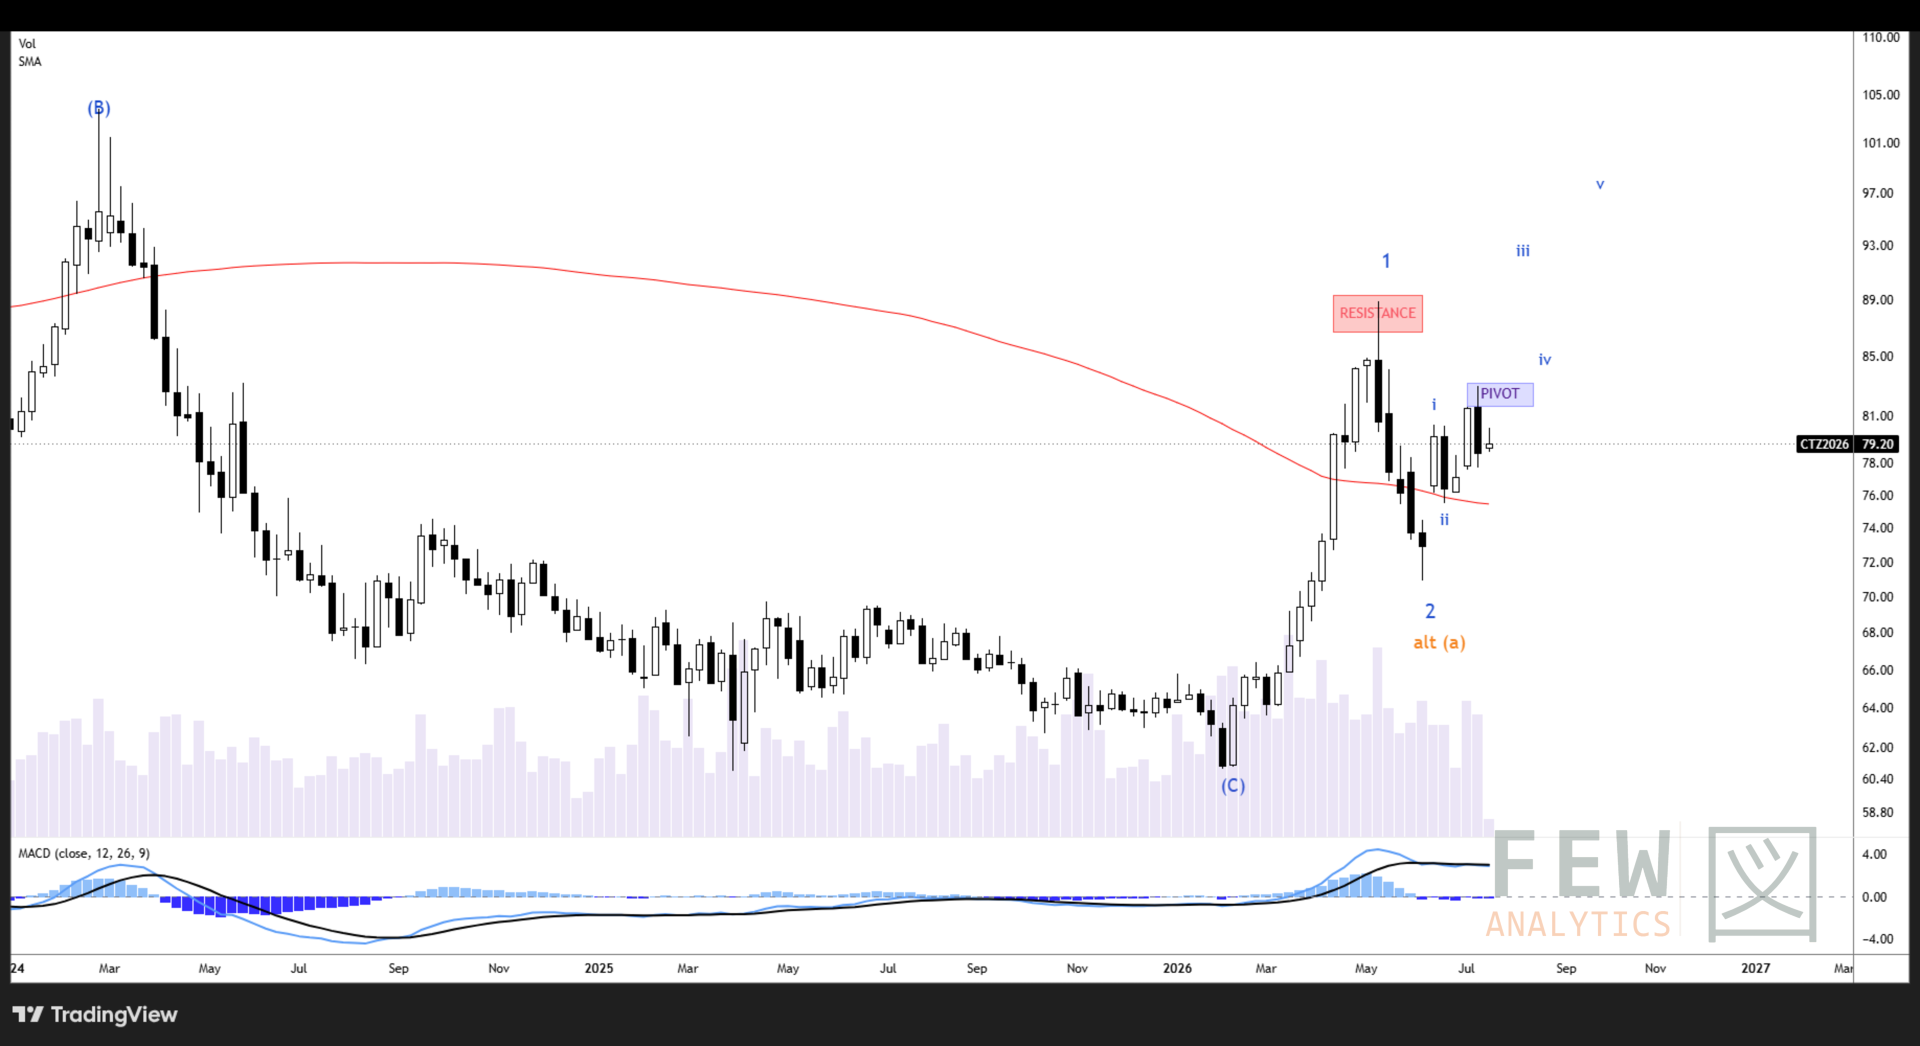
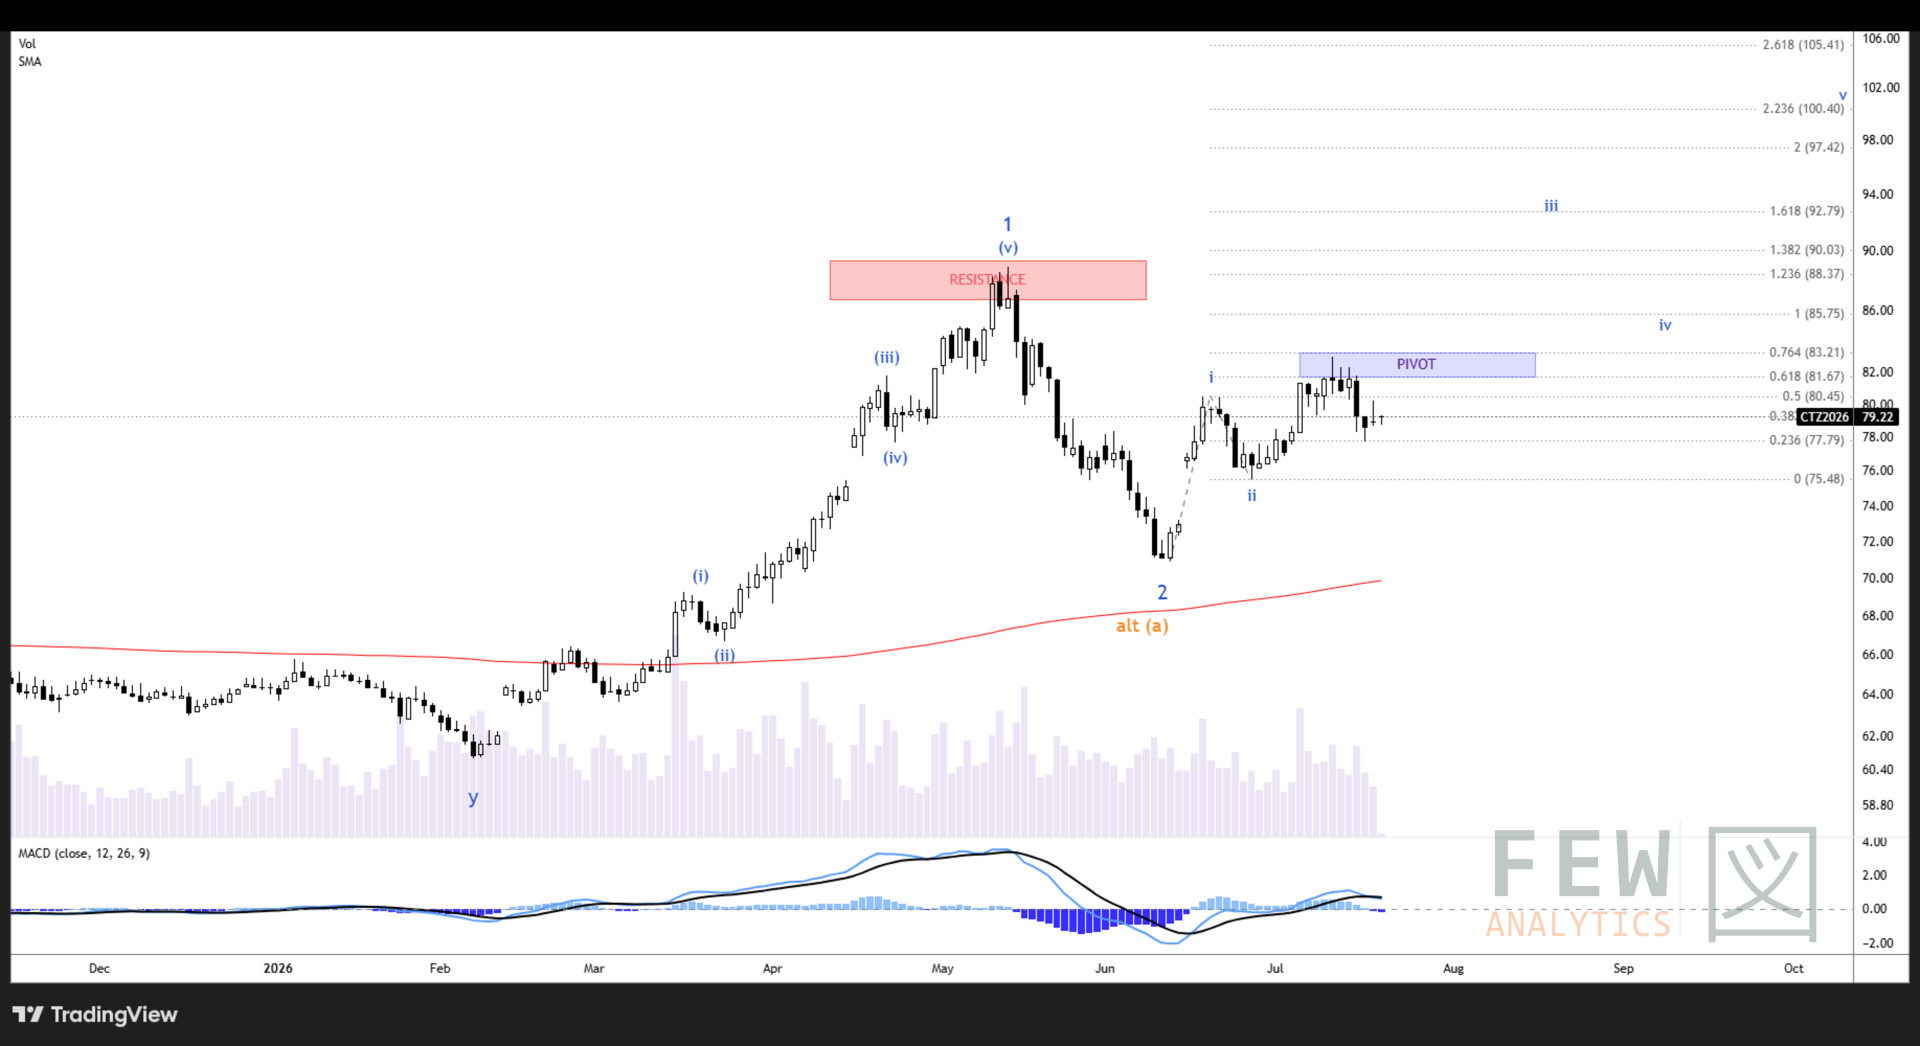
As discussed last week, CT is long-term bullish, with the expectation that the chart breaks above the May 2026 high of 88.88. As forecast last week, we saw some backing and filling over the week, but nothing has changed the bullish outlook for cotton. A break below 75.50 means something else is playing out.
Tactical
Recent price action is consistent with last week's expectation that the pivot would chop CT around for another pullback. If the chart is to remain near-term bullish, we should really see the wave iii move up to 92 start in earnest this week. Too much more chopping around here reduces the
probability of immediate bullishness and means we may have something else to deal with. We remain bullish while price is above 75.50.
Cotton Positioning
CFTC data for 14 July showed managed money accounts hold a net long of 49,684 contracts, an increase of 10,578 from 39,106 the prior week. This net position was made up of 70,648 longs, up by 4,092 contracts from 66,556, and 20,964 shorts, a reduction of 6,486 contracts. The net position was driven by mix of additional longs(+4,092) and short covering(-6,486) as the price continued to increase towards the end of the week ending 14 July. The past three weeks have seen funds build their length(+9,869) and reduce their short position(-7,830), showing a more bullish bias.
Commercials net position moved 9,044 contracts WoW, an increase in net short to 130,625 from 121,581. Driven by additional shorts of 9,361 contracts from 196,559, and an addition of longs from 74,978 to 75,295.
Open interest rose by 2,634 contracts to 456,949, sitting in the 97th percentile of its 20-year range meaning it has only been here 3% of the time. The five-year chart corroborates this: although open interest remains below the May 12 peak of 515,041, it is still elevated relative to most of the past five years.

Balance sheet
The July 10 WASDE remains the latest official balance-sheet read and incorporates the June 30 Acreage report. It is bearish for new crop. USDA left the 2025/26 use side unchanged—exports at 12.20M bales, domestic use at 1.55M and ending stocks at 4.20M, equivalent to a 30.5% stocks-to-use ratio—while trimming the season-average farm price 0.5 cent to 62.5c/lb. For 2026/27, production was raised 400k bales to 13.70M and carryout 400k to 4.10M; domestic use remains 1.60M, exports 12.30M and the price forecast 73.0c/lb. New-crop stocks-to-use rises to 29.5%, up from 26.6% in June.
The change was acreage-driven. NASS put planted area at 9.85M acres, and WASDE translated that into 7.54M harvested acres using ten-year regional abandonment, implying a 23.5% abandonment rate. The national yield was lifted 6 lb to 872 lb/acre because the acreage mix shifted toward the Southeast and Delta and away from the Southwest. Texas all-cotton plantings came in at 5.425M acres, up 2.0% year over year, with Georgia at 1.000M, Mississippi at 430k and Alabama at 360k. Importantly, the 7.54M-acre harvested figure is still a USDA assumption rather than a NASS survey estimate; the first 2026 harvested-area estimates are due with the August production update.
Texas remains the main downside risk to that acreage-and-yield framework. As of July 19, only 30% of the Texas crop was rated good or excellent and 28% was poor or very poor, compared with 45% good or excellent and 18% poor or very poor nationally. The July sheet therefore does not tighten unless actual abandonment or yield losses run worse than the historical assumptions now embedded in USDA’s forecast.
The global balance is tightening even as U.S. carryout remains burdensome. USDA raised 2026/27 world production by 1.22M bales to 117.26M, but consumption at 121.95M still exceeds output by 4.69M. Ending stocks are projected at 71.22M, near the post-2018/19 low and only 33k bales above 2021/22. Brazil’s new-crop production was raised 500k to 18.00M, while exports remain 15.00M. That export figure is no longer a record—the revised 2025/26 estimate is now 15.30M—but Brazil still accounts for roughly 34.6% of projected world trade, versus 28.4% for the U.S.
Planting has progressed into squaring
Monday’s Crop Progress report showed squaring at 73% nationally, up from 60% the previous week, three points ahead of last year’s 70% and one point ahead of the five-year average of 72%. Texas reached 64%, up from 50%, even with last year but two points behind the 66% average.
Boll setting reached 32% nationally, up from 22% and exactly even with both last year and the five-year average. Texas boll setting advanced to 30%, up from 22%, even with last year and two points ahead of the 28% average. Development therefore remains broadly on schedule, with the crop now moving decisively into the boll-setting phase

Condition Report
The national condition report was mixed rather than uniformly weaker. U.S. cotton was rated 45% good/excellent, up one point from 44% last week but still well below last year’s 57%. The fair category fell to 37%, from 40%, while poor/very poor increased to 18%, from 16%.
The one-point improvement in the good/excellent share therefore does not represent a clean improvement in the crop. The middle of the distribution narrowed as acreage moved toward both ends, and the share rated poor or very poor continued to expand at a time when more of the crop is entering early boll development.
Texas remains the main concern. The Texas crop held at 30% good/excellent, but fair declined to 42%, from 46%, while poor/very poor jumped to 28%, from 24%. Unlike the previous report, when the main deterioration was a decline in the good/excellent category, this week shows a clearer migration of acreage from fair into poor or very poor. That is a more direct indication of increasing crop stress.
The July WASDE already assumes 9.85 million planted acres against 7.54 million harvested acres, implying abandonment of approximately 23.5%. USDA currently projects 2026/27 production at 13.70 million bales and ending stocks at 4.10 million bales. Consequently, the market will likely need evidence that abandonment or yield losses are exceeding those assumptions before materially tightening the new-crop balance sheet.

US Cotton Export & Sales
For the week ended July 9, current-crop upland net sales fell to a marketing-year low of 34,400 running bales, down 48% from the previous week and 64% below the four-week average. Bangladesh was the largest buyer at 10,600 RB, followed by Vietnam at 5,800 RB, Pakistan at 5,300 RB, Peru at 4,800 RB and Thailand at 2,700 RB.
New-crop 2026/27 upland sales slowed sharply to only 4,100 RB. Sales were reported for Pakistan at 4,200 RB, Peru at 3,800 RB, Vietnam at 1,700 RB and Indonesia at 1,200 RB, but were substantially offset by reductions for Mexico at 4,700 RB, Nicaragua at 1,200 RB, Guatemala at 500 RB, Honduras at 400 RB and Japan at 100 RB.
Upland shipments also lost ground, falling to 214,900 RB, down 7% from the previous week and 14% below the four-week average. The leading destinations were Vietnam at 77,100 RB, Turkey at 36,100 RB, Pakistan at 21,500 RB, India at 17,000 RB and Mexico at 14,000 RB.

Pima net sales improved to 3,600 RB, up 38% from the prior week and 11% above the four-week average. India purchased 2,500 RB, China 700 RB and Vietnam 400 RB. New-crop Pima sales totaled 2,400 RB, split between India at 1,400 RB and Peru at 1,000 RB. Pima exports declined to 7,800 RB, down 27% for the week and 45% below the four-week average.
On a 480-pound statistical-bale basis, all-cotton current-crop sales totaled 39,100 bales, while shipments totaled 229,300 bales. Cumulative current-crop shipments reached 11.152 million bales, approximately 14,100 bales behind last year’s 11.166 million at the same point. The small year-over-year shipment advantage reported the previous week has therefore been erased.
Total current-crop commitments stand at 12.815 million bales, approximately 615,000 bales above USDA’s 12.20 million-bale 2025/26 export forecast. New-crop all-cotton sales totaled only 6,700 bales for the week, lifting cumulative 2026/27 commitments to 2.683 million bales.

To reach USDA’s 12.30 million-bale target, shipments would need to average approximately 349,000 bales per week over the final three full reporting weeks, before the one-day July 31 stub period. This week’s 229,300-bale shipment pace was approximately 120,000 bales below that threshold.
Commitments remain more than sufficient on paper, leaving a cushion for cancellations or sales rolled into the next marketing year. However, the shipment pace must accelerate materially if USDA’s forecast is to be achieved through physical exports rather than adjustments at the end of the crop year.

Texas soil-moisture readings improved in the latest NASS report. Texas topsoil rated short or very short declined to 52%, from 57% the previous week, while subsoil rated short or very short eased to 49%, from 53%.
The national picture moved in the opposite direction. U.S. topsoil rated short or very short increased sharply to 41%, from 33%, while subsoil rated short or very short rose to 40%, from 36%. Texas therefore received enough moisture to improve the broad soil-moisture measures, but the improvement has not yet translated into stronger cotton ratings: Texas poor/very poor increased four points to 28%. That divergence suggests the rainfall was unevenly distributed, arrived too late for some acreage or was insufficient to reverse accumulated crop stress quickly.

The latest released U.S. Drought Monitor, based on data valid July 14, is more constructive for Texas. Approximately 25.8% of the state was in D1–D4 drought, down from 30.9% in the previous report. Severe drought or worse, D2–D4, covered approximately 8.9%, down from 11.3%.
The improvement is consistent with the better Texas topsoil and subsoil readings, although the Drought Monitor depicts broad-scale conditions and local agricultural impacts can vary considerably. More importantly for cotton, Texas condition ratings did not improve alongside the drought map: good/excellent remained at 30%, while poor/very poor increased to 28%. The July 14 map also does not capture rainfall occurring after its data cutoff.

CPC’s latest 6–10 day outlook, covering July 27–31, favors above-normal temperatures across North, South and West Texas. Below-median precipitation is favored in all three Texas regions. The accompanying discussion places most of the Southern Plains within the below-normal precipitation area and assigns forecast confidence of 4 out of 5.
The 8–14 day outlook, covering July 29–August 4, continues to favor above-normal temperatures across North, South and West Texas. Precipitation shifts back to near median across all three regions, rather than remaining explicitly below median. Forecast confidence is 3 out of 5.
The week-two outlook therefore retains the heat risk but is less clearly dry than the 6–10 day period. The most immediate concern is the hotter and drier July 27–31 window as a growing share of the Texas crop moves through boll setting.

Cotton On-Call
No major outlier in the latest Cotton On-Call report: A decrease of 1,201 contracts in the unfixed call sales and still heavy concentration in the unfixed call purchases with 45,024 contracts in the new-crop December 2026 contract.

Outlook for Cotton
Bull Case
Texas stress worsened: good/excellent held to 30%, with topsoil short/very short at 49%.
Commitments remain strong: 12.815m bales, about 615k above USDA’s export target.
Rain outlook is mixed: missed West Texas showers would keep abandonment risk elevated.
Bear Case
USDA raised supply: U.S. production increased to 13.7m bales and ending stocks to 4.1m.
Rain remains the key cap: verified High Plains coverage would quickly reduce the weather premium.
Demand is still soft: sales improved, but remain below recent averages; on-call positioning is not clearly bullish.
Base Case
Crop progress: U.S. 73% squared / 32% setting bolls; Texas 64% / 30%.
December near 80.9c: support 80.0/79.3c; resistance 81.5/83.0c.
Bias: neutral-to-firm. Constructive above 79.3–80.0c; bullish above 83c; bearish if rain verifies and December breaks 79.3c.
Coffee
Coffee Price Action
Arabica traded sideways over the week ending Tuesday 21 July, price had a high of 336.4 before settling 322.1, week change of -1.44% (4.65 cents). The market has softened relative to the prior week’s historic moves and has almost established a new trading range between 310-355, which, although wide, is reasonable relative to the last few weeks’ price swings. September Arabica settled at 322.10, December at 307.90, leaving the U/Z spread at +14.2 c/lb, fallen from +18.1 c/lb the prior week. July settled at 331.95 with open interest down to 82 lots from 466, leaving the N/U spread at +9.85 c/lb.
Robusta traded similarly, with September moving $93/t (-2.38%) down during the week and settled 3,818. Prices remain well above the early-July lows near 3,714. September settled 3,849 and November at 3,799, leaving the U/X spread +$19/t, which has fallen WoW by $30/t from $49/t. The forward curve remains in steady backwardation, with the terminal month at 3,636.
ICE arabica stocks fell again to 332,945 bags, a fresh 2.25-year low, while robusta certified stocks increased to around 706k bags. Margins for arabica remain at 21,116.25. Exchanges increasing margins tends to lead to more bearish outlooks.
Technical Analysis
Strategic
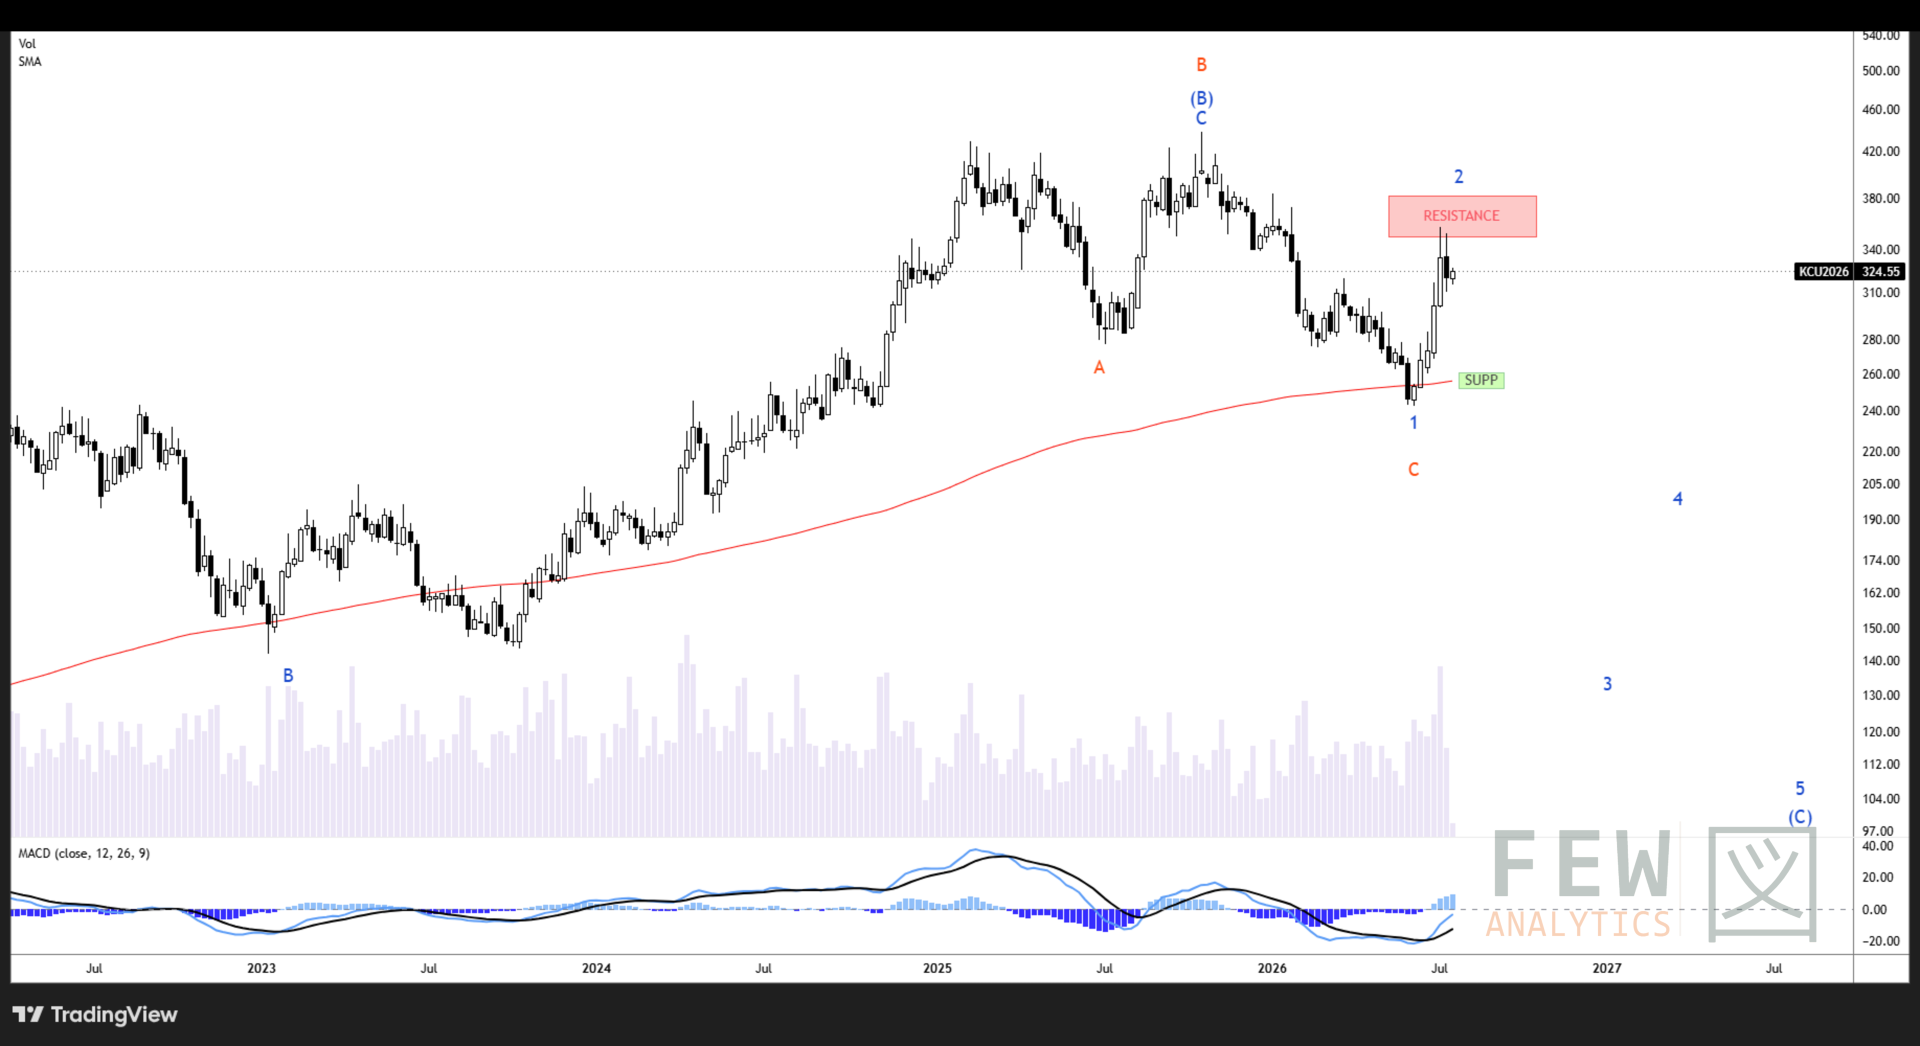
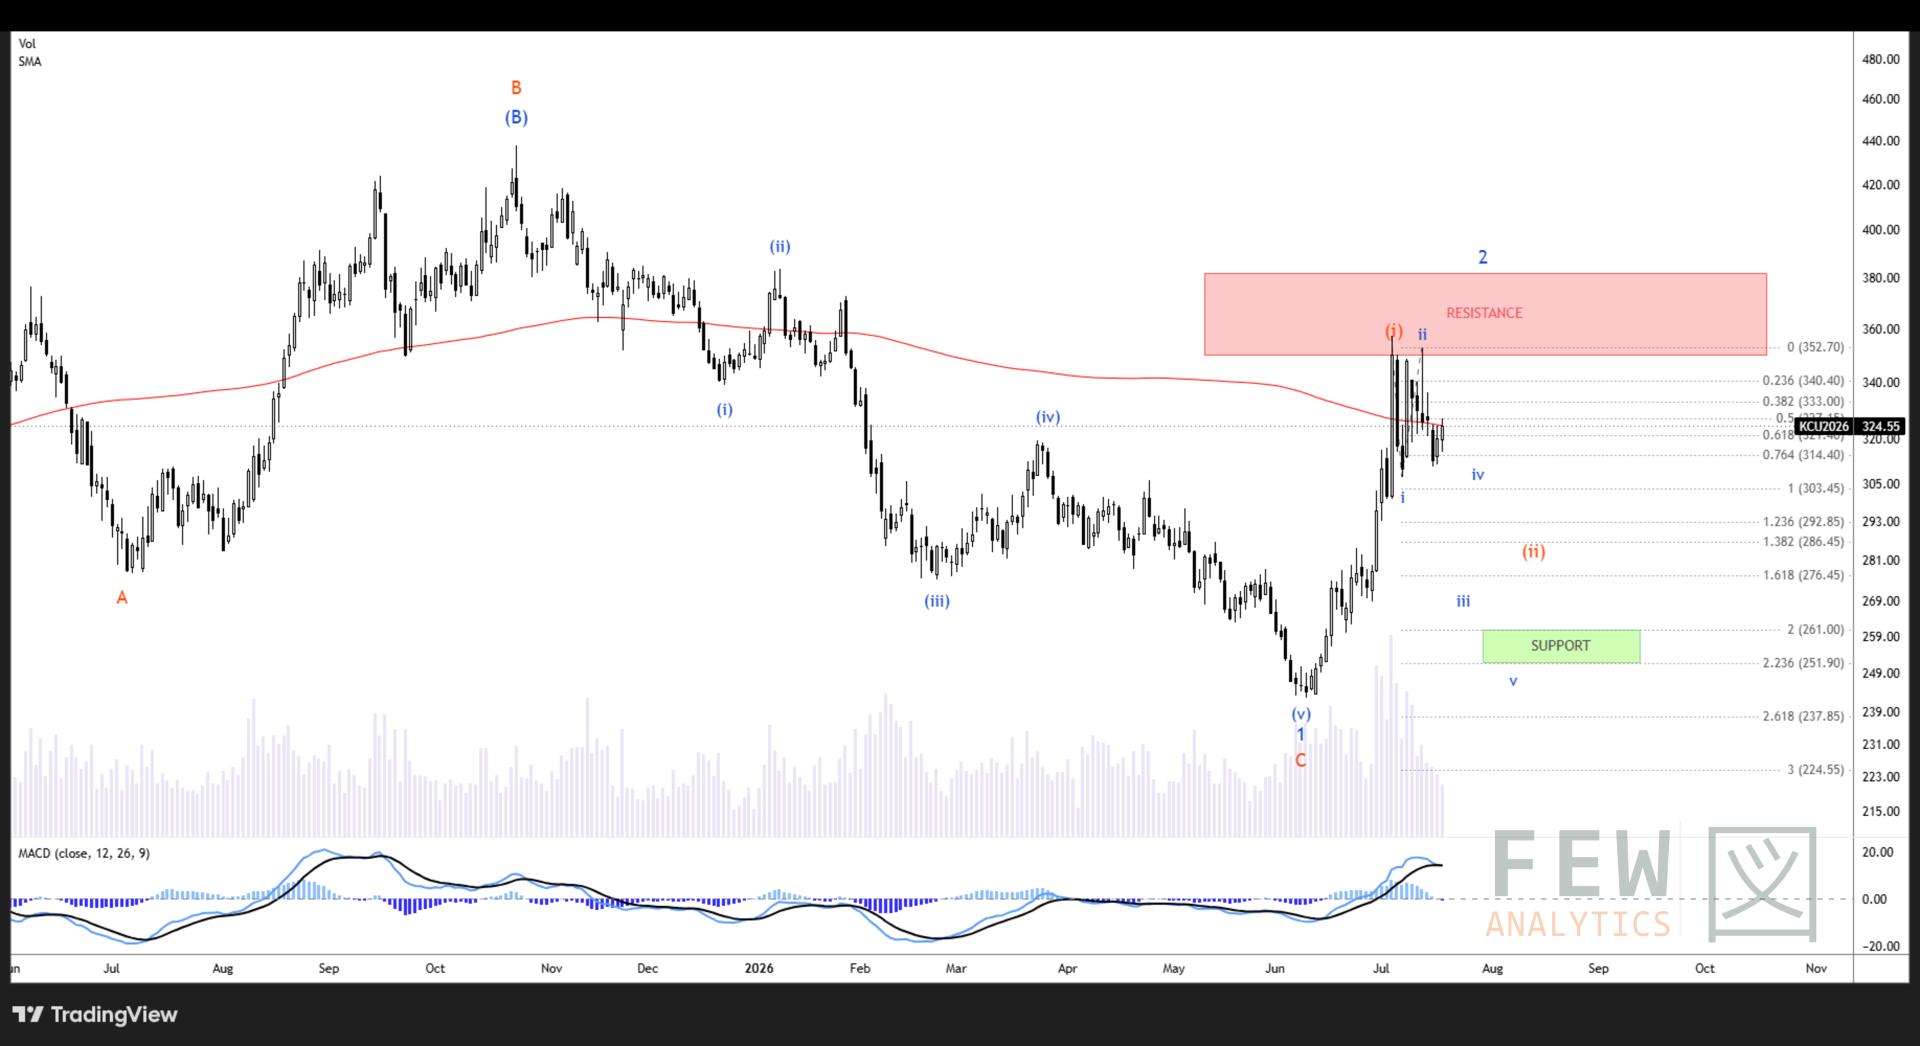
Arabica coffee continues to chop within the 300–350 area, offering little clue as to how the market will resolve this high consolidation. If anything, the continued chop lowers conviction for the bear case, as the market should ideally have followed through to the downside by now. The bearish base case becomes slightly less probable, but we simply have to wait until the market shows its hand.
Tactical
While the longer term scenario is less clear, both options point lower in the short term. The blue primary count would deliver a sharp drop in wave iii, whereas the alternate bullish count sees us chopping lower towards 280 in wave (ii). The structure of the next decline should really help clear
up where we stand on the longer timeframes.
Physical Pricing
Brazil differentials:
NY 2 17/18 Fine Cup differentials for September and December now stand at 8 over Sept-26 and 10 over Dec-26, respectively.
Additionally:
NY 2/3 14/16 - Fine Cup stands at 10 under Sept-26 and 6 under Dec-26,
NY 2/3 15/16 - Fine Cup stands at 8 under Sept-26 and 6 under Dec-26,
Moka - (9/10/11) - Fine Cup stands at 13 under Sept-26 and 11 under Dec-26.

Certified stocks: Arabica at 332,945 bags as it continues to drop ~243,047 bags in the last 4 months, a 41.5% decrease, while Robusta remains steady currently around ~706k bags
Stock stored is heavily skewed in Antwerp (220,302 bags), and primary origin led by Honduras, then Peru. Latest aging concentrated in 181-210 days, with a long tail.


Coffee Positioning
Arabica’s fund position holds, with managed money net long 24,967, down only 544 from 25,511 the prior week. Longs fell 1,623 to 38,431 and shorts fell 1,079 to 13,464. Driven by a mix of long liquidation and reduction in shorts.
Commercial accounts held a net short position of 27,599 contracts, with 44,790 longs and 72,389 shorts. The net short deepened as shorts grew +3,447, outpacing the +1,280 rise in longs.
Other Reportable have changed their position from net short in previous weeks to net long 1,532 contracts, primarily moved by short covering (-2,624).
Robusta open interest rose 1,265 to 126,988 contracts. Contrastingly, KC open interest fell 13,977 from 242,253 to 228,276 (5.77% decrease).


Outlook
Bull Case
ICE arabica stocks fell to 332,945 bags, a 2.25-year low; Sep/Dec backwardation narrowed to roughly +14.2 c/lb.
Brazil’s harvest is only 64% complete versus 77% last year, with rain delays and cherry drop threatening prompt quality and availability
El Niño risk around Sep–Oct flowering keeps a retest of 350–357c in play.
Bear Case
Sep settled at 322.10c, down 1.44% Tuesday and 30.9c below the 357c spike; two ICE margin hikes and thin liquidity favour sharp reversals.
Brazil’s record crop remains the ceiling: USDA 71.9m bags; private estimates 66.7–75.4m bags.
Robusta is weak confirmation: stocks recovered to 4,237 lots, Vietnam H1 exports rose 7.3% to 1.05 MMT, and funds hold 43,071 net-long contracts.
Base Case
Tight nearby, looser forward—but now a high-volatility range rather than a clean breakout.
Sep near 322.1c: support 320–315c, then 310–300c; resistance 340–352c, then 357c.
Bias: fade rallies into 340–350c, but avoid chasing shorts below 315c while stocks remain under 350k bags and U/Z holds near +14.2c.


