

Summary
Key Takeaways:
Cotton remains a weather market, with Texas continuing to drive sentiment. The board has started pricing in weather risk, but a sustained rally still requires visible deterioration across the High Plains or increased abandonment.
Higher U.S. planted acreage continues to cap upside. While the longer-term global balance sheet remains supportive, softer export sales and shipments provided less support than in recent weeks.
Brazil's record coffee crop remains the dominant bearish influence, but harvest delays and quality concerns are keeping nearby volatility elevated.
Tight certified coffee stocks continue to underpin prices, increasing the market's sensitivity to harvest disruptions and adverse weather.
The coffee market remains caught between strong supply expectations and short-term supply risks, with slower harvest progress and the potential for renewed rainfall keeping squeeze risk alive.
Coffee retains greater near-term volatility than cotton, while cotton's next move will largely depend on weather developments across key Brazilian growing regions.
Technical Analysis
Read this week’s Technical Analysis here. Key Takeaways:If you want to understand the charts further, you can read about how to interpret them here.
Cotton remains a weather market, but this week delivered firmer board response rather than a clean bullish trigger. Planting has rolled off the weekly report after reaching 97% last week, while squaring advanced to 49%, slightly ahead of the 47% five-year average, and boll setting reached 14%, in line with average. Conditions slipped again, with national good/excellent down to 46% from 48%, while poor/very poor held at 16%. Texas remains the key risk: it is 39% squaring and 15% setting bolls, but condition eased to 36% good/excellent, with 23% poor/very poor. The June acreage report remains an added cap, with all-cotton plantings at 9.85m acres, up 6.1% from last season and 2.2% above the prior estimate. December cotton is closer to 80.8c/lb, so the board has started pricing weather risk, but still needs visible High Plains deterioration or abandonment risk to extend higher.
USDA’s 2026/27 world balance sheet continues to support the longer-term cotton outlook, with production at 116.0m bales versus mill use of about 121.8m, and ending stocks still pointed lower toward 71.1m bales. Weekly U.S. demand was softer on both sales and movement: Upland sales fell to 49,000 RB, down 42% from the prior week, while shipments slipped to 218,800 RB, down 27%. Supportive overall, but less helpful than last week and not yet strong enough to offset higher acres and a board that still wants proof of Texas or High Plains losses.
Brazil remains the coffee market’s record-crop anchor, but the nearby trade has become increasingly volatile, with harvest-disruption risk colliding with profit-taking following the recent spike. USDA/FAS puts Brazil’s 2026/27 crop at a record 71.9m bags, while private estimates sit closer to 75.3m–75.9m bags. Safras & Mercado pegged harvest at 52% complete as of July 1, behind 60% last year and the 55% five-year average, keeping flow and quality risk alive. September arabica backed off to around 317.6c/lb after Monday’s surge, while certified arabica stocks fell to 362,466 bags, a 2.25-year low. Robusta stocks recovered to 4,183 lots after recently hitting 3,631 lots. The big Brazil crop still caps rallies, but tight certified stocks, slower harvest progress and renewed mid-July rain risk keep the squeeze risk alive.
Macro
Macro remained a headwind this week, with the energy impulse no longer fading. Brent rebounded to about $76/bbl, rebuilding the polyester cost floor under cotton, while the U.S. 10-year yield held near 4.55% and the dollar index remained around 101.21. The bigger story continues to be rates, where the market has spent 2026 tearing up the easing cycle.

This week’s data did not really break that hawkish setup. Payrolls slowed to 57k versus 110k expected, with prior months revised down by 74k, but inflation signals remained sticky. ISM services prices paid remained high at 67.7, NY Fed one-year inflation expectations rose to 3.7%, and the trade deficit widened to $77.6bn.
Fed funds futures still price roughly a 60%+ chance of a September hike, so macro remains restrictive. Net-net: cotton still needs a clearer Texas weather break, while coffee can still squeeze on harvest disruption and frost risk. However, both remain vulnerable while yields, the dollar and inflation risk stay firm.


Cotton
Cotton Price Action
ICE cotton shifted from stabilization to a stronger recovery this week. By Tuesday, 7 July, July 2026 settled at 76.94 c/lb, October at 79.71 c/lb, December at 81.29 c/lb and March 2027 at 82.68 c/lb. From the 2 July closes, that put the board up 416 to 437 points, with December gaining 417 points and March 416 points.
The move has more than repaired the late-June break in the active contracts. December is now 162 points above its 18 June reference and March 163 points above, while July is 89 points higher. Against the 12 June base, July, December and March are up 400, 487 and 504 points respectively. December has reclaimed 80 c/lb, and March is now pressing into the lower end of the former 82 to 84 c/lb resistance zone.
July remains a poor price signal. By 7 July, July had only 6 contracts of volume and 56 contracts of open interest. October was also thin, with 67 contracts of volume and 166 contracts of open interest. December is the cleaner benchmark, with 52,310 contracts of volume and 204,599 contracts of open interest.
The broader cotton benchmark also improved, quoted at 81.24 c/lb on 7 July, up 3.75% on the day and 4.68% over the month. Prices are still below the May high, with December’s upper range still marked at 88.08 c/lb, but the market is now testing resistance rather than simply stabilizing below it.
Cash indicators were less supportive. USDA’s seven-market spot average fell to 69.51 c/lb for the week ending 2 July, down 133 points from 70.84 c/lb the previous week. Spot transactions recovered to 3,865 bales from 592 bales, but remained below 6,904 bales a year earlier. Season-to-date transactions stood at 1.520 million bales, still well above 981,244 bales last year.
Crop data offered some support. As of 6 July, 49% of the U.S. crop was squaring, up from 37%, while 14% was setting bolls, up from 9%. Conditions slipped to 46% good/excellent, down from 48% the prior week and below 52% a year earlier.
The message is more constructive than last week, but not fully bullish. Futures have staged a meaningful recovery, with December back above 80 c/lb and March into the 82 to 84 c/lb zone. However, spot prices softened and physical demand remains uneven. December is now the key signal: a sustained close through 82 to 84 c/lb would restore a bullish tone, while a break back below 79 to 80 c/lb would make this look like short-covering rather than a confirmed reversal.
Technical Analysis
Strategic
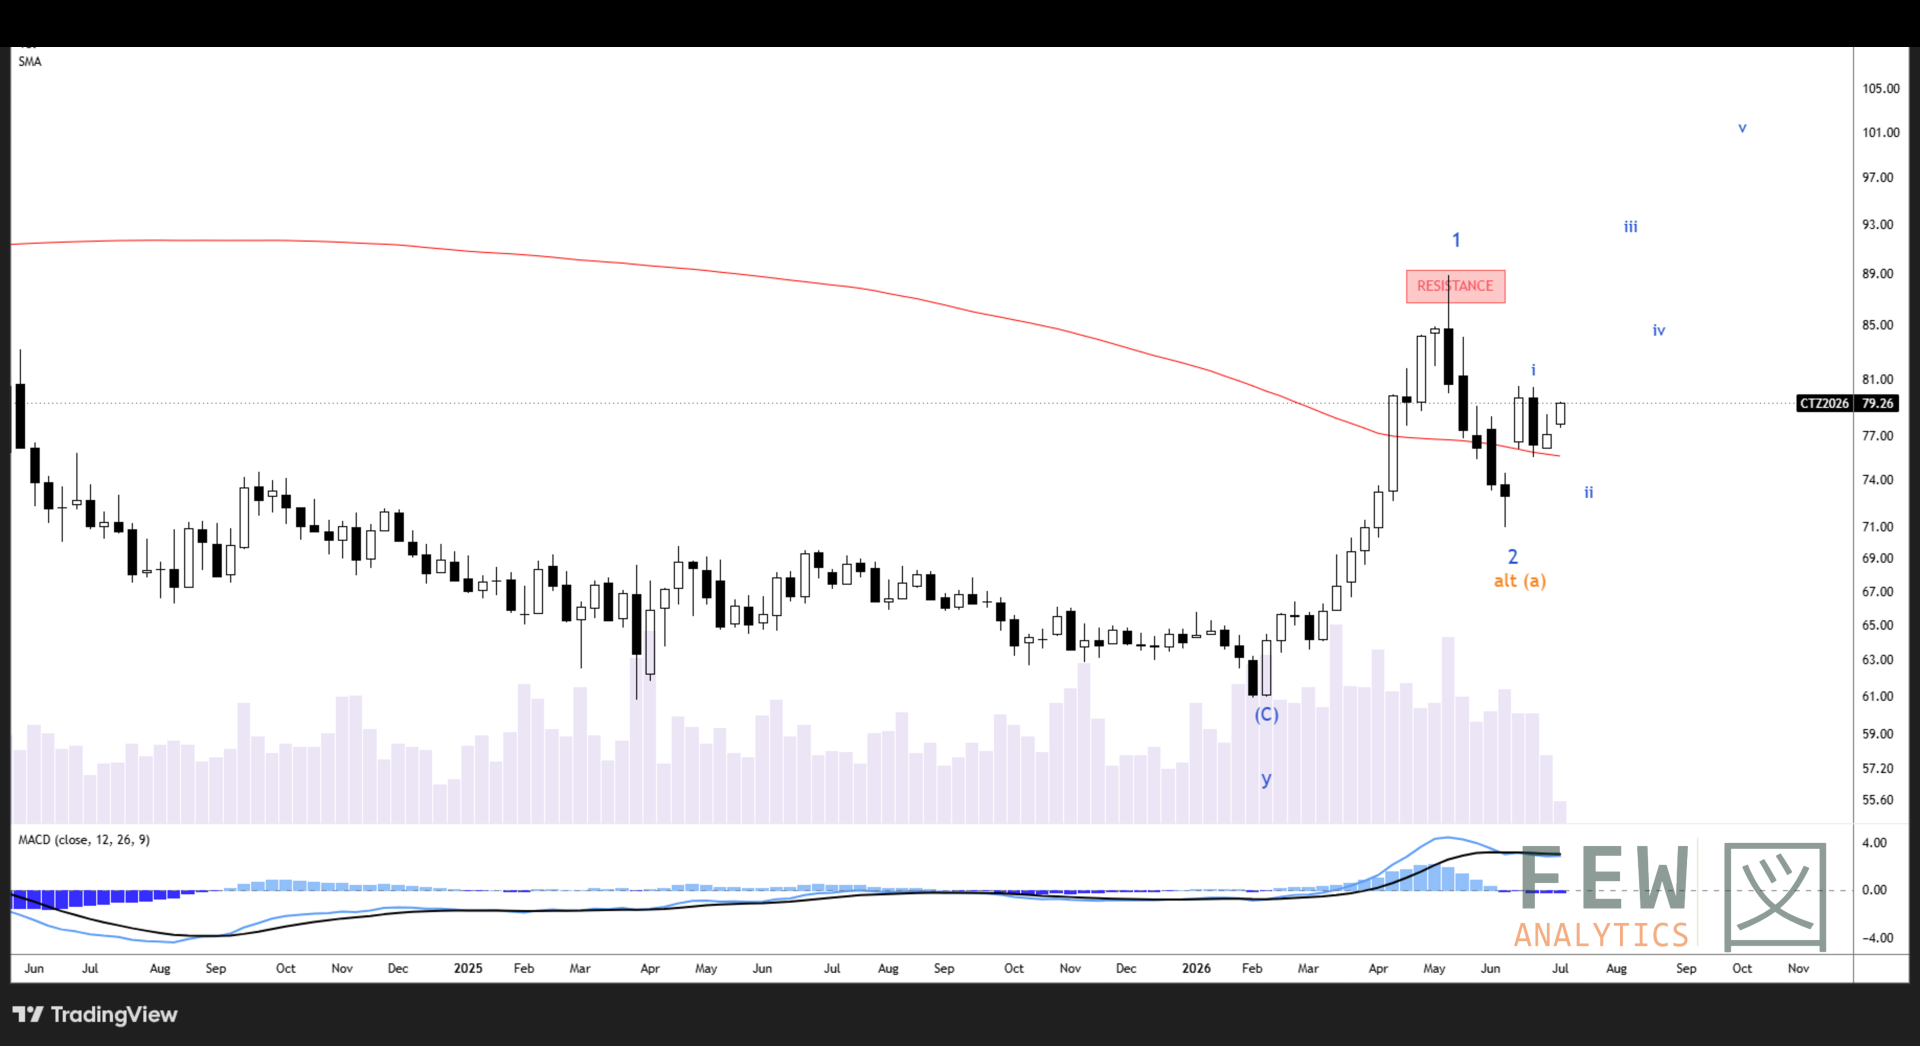
Cotton futures continue to build a bullish strategic setup, continuing higher since last week. Once this near-term wave structure is bedded down, we continue to expect much higher prices in cotton going into 2027, in the long term wave 3 up.
Tactical
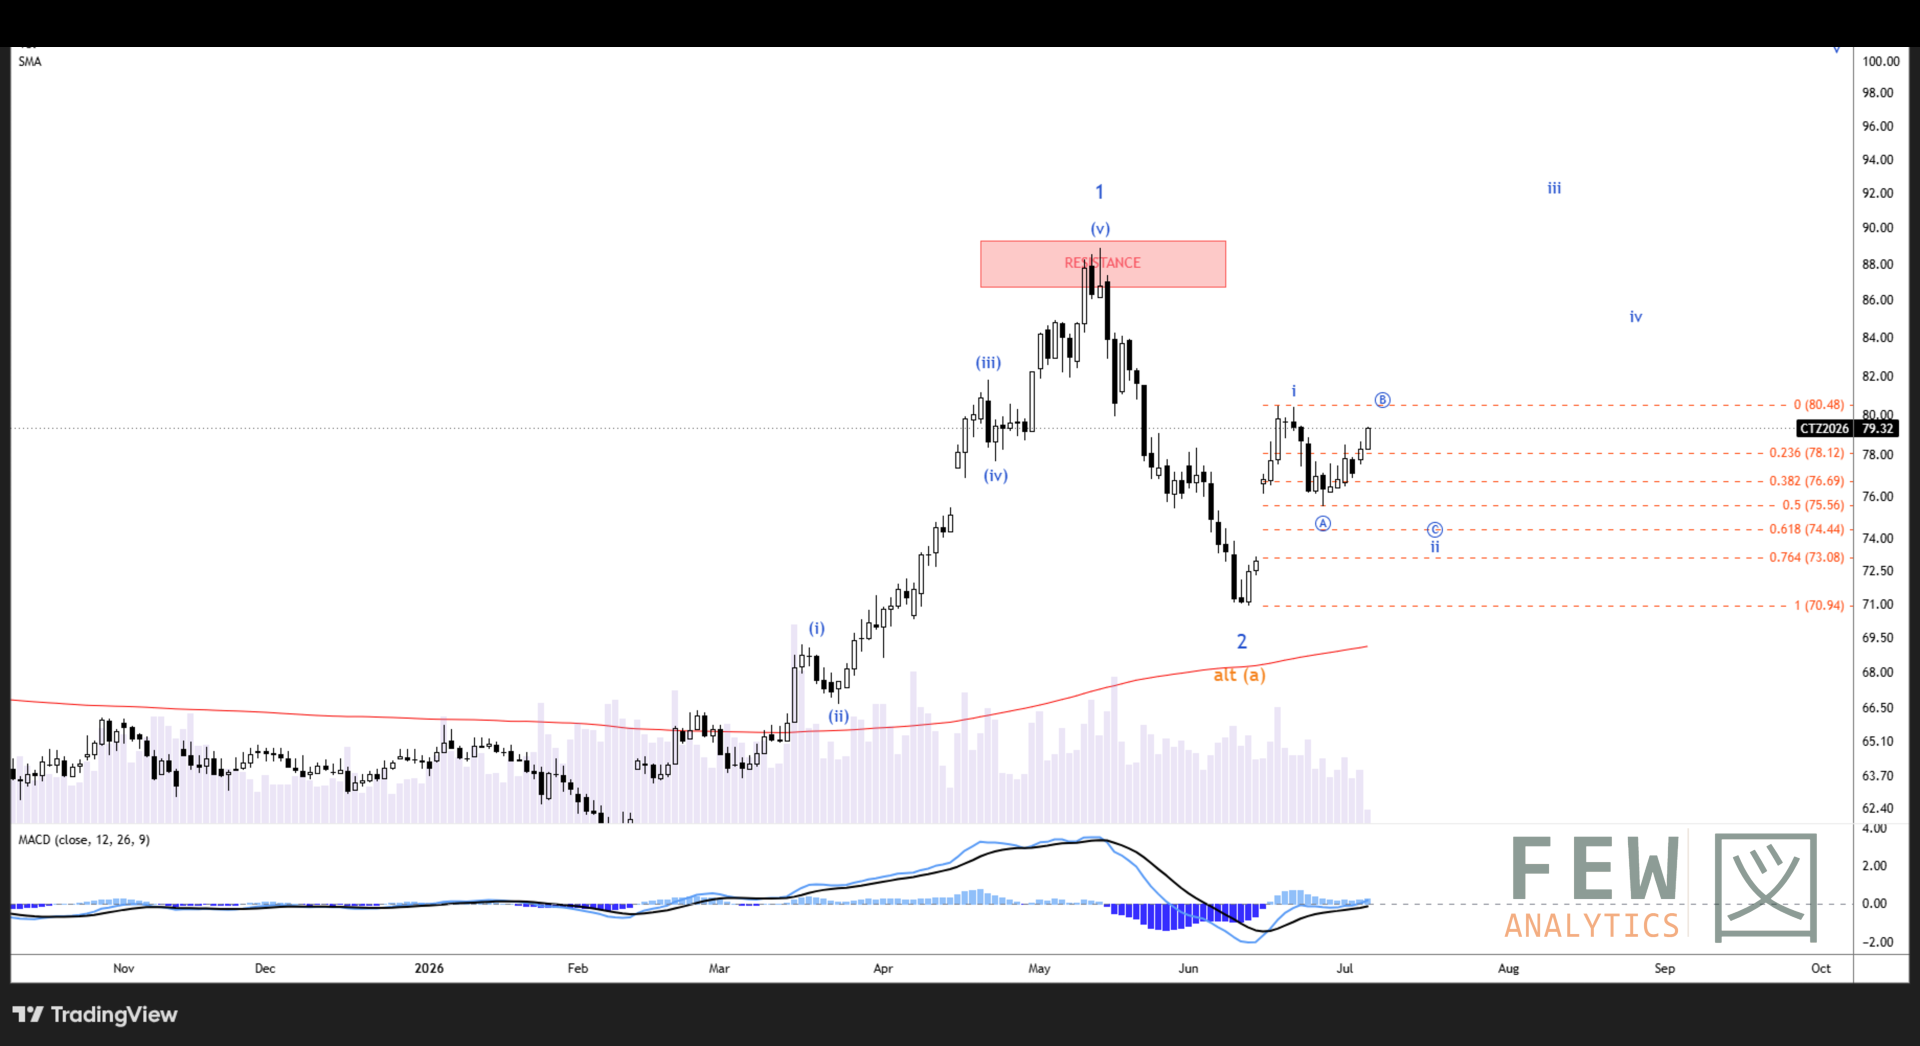
The structure off the June 26th low counts best as a b wave up, and appears almost complete. Next, we would expect a c wave down to complete wave ii around the 74.40 region. From there we expect a strong move to fresh highs in wave iii. It is possible cotton already bottomed at the 50% retracement for wave ii, but that is a less likely scenario.
Cotton Positioning
CFTC data for 30 June reported modest changes WoW. Managed money held a net long of 31,985 contracts, down 6,460 from 38,445 the prior week. This comprised 60,779 longs and 28,794 shorts, with a net decline driven by both fresh shorts (+3,312) and long liquidation (-3,148).
Conversely, commercials held a net short of 109,053 contracts, comprising 71,416 longs and 180,469 shorts. Longs rose by 4,821 and shorts fell by 3,108. The 7,929 reduction in net short exposure resulted from adding longs and short covering.
Open interest rose by 3,347 contracts to 428,610, an increase of 0.78%, sitting in the 97th percentile of its 20-year range meaning it has only been here 3% of the time. The five-year chart corroborates this: although open interest remains below the May 12 peak of 515,041, it is still elevated relative to most of the past five years.

Balance sheet
As of this update, the July WASDE has not yet been released; USDA lists the July WASDE for release at 12:00 p.m. ET on July 10, so the latest official USDA cotton balance sheet is still the June WASDE. USDA’s U.S. cotton balance remains heavy, though the June WASDE was modestly more supportive than the prior month. For 2025/26, USDA has exports at 12.20 million bales, domestic use at 1.55 million bales, ending stocks at 4.20 million bales, and the farm price at 63.0 cents/lb. That leaves old-crop stocks-to-use near 30.5%, or roughly 31%. For 2026/27, USDA has production at 13.30 million bales, exports at 12.30 million bales, domestic use at 1.60 million bales, ending stocks at 3.70 million bales, and the farm price at 73.0 cents/lb. New-crop stocks-to-use is about 26.6%.
The main acreage offset remains the June Acreage report. NASS estimated 2026 all-cotton planted area at 9.85 million acres, up 6.1% from 2025 and 2.2% above the March Prospective Plantings figure. Upland cotton area was estimated at 9.70 million acres, while Pima was estimated near 150,000 acres. This is mildly bearish relative to the June WASDE baseline because the June balance sheet was still built on 9.64 million planted acres and 7.38 million harvested acres. That implies abandonment of about 23.4%. Applying that same abandonment rate to the new 9.85 million-acre planted estimate would lift harvested area to about 7.54 million acres. At USDA’s June yield assumption of 866 lb/acre, production would be near 13.6 million bales, roughly 0.3 million bales above the June WASDE forecast. Conversely, keeping harvested area near 7.38 million acres would require implied abandonment to rise to about 25.1%.
The regional mix still matters. Texas all-cotton planted area was estimated at 5.425 million acres, up 2.0% from last year, while several Delta and Southeast states also posted meaningful acreage gains: Georgia at 1.000 million acres, Mississippi at 430,000 acres, Alabama at 360,000 acres, and Kansas at 120,000 acres. This means West Texas dryness remains important, but it may not be enough on its own to tighten the balance sheet unless abandonment or yield losses exceed what USDA already built into the June WASDE.
The global outlook remains more constructive than the U.S. balance sheet. USDA projects 2026/27 world production at 116.04 million bales, below consumption of 121.76 million bales, with global ending stocks declining to 71.13 million bales. However, Brazil remains a formidable export competitor. USDA forecasts Brazil’s 2026/27 crop at 17.50 million bales and exports at 15.00 million bales, equal to about 34.6% of world trade. By comparison, U.S. exports are forecast at 12.30 million bales, or roughly 28.4% of global trade.
Planting has progressed into squaring
With planting effectively complete, USDA/NASS’s latest Crop Progress report has shifted the focus to crop development. As of the week ended July 5, U.S. cotton was 49% squaring, up from 37% a week earlier and ahead of both last year and the 5-year average, each at 47%. Texas was 39% squaring, up from 32% the prior week, just behind last year’s 40% and equal to the 5-year average of 39%.
Boll setting is also on schedule. Nationally, 14% of the crop was setting bolls, up from 9% a week earlier, compared with 13% last year and the 5-year average of 14%. Texas was 15% setting bolls, up from 11%, matching both last year and the 5-year average at 15%.

Condition Report
The national condition report slipped again. U.S. cotton was rated 46% good/excellent, down from 48% last week and below last year’s 52%. The fair category rose to 38%, while poor/very poor held at 16%. The national crop is not collapsing, but the good/excellent share continues to fade at a point when the market is increasingly focused on July weather and early boll-setting conditions.
Texas remains the main concern. The Texas crop was rated 36% good/excellent, down from 39% last week, while fair rose to 41%. Poor/very poor eased slightly to 23%, down from 25%, but the overall distribution still looks stressed. The deterioration this week is therefore less about a fresh jump in poor/very poor acreage and more about fewer acres holding in the good/excellent category. That gives the market a weather-risk story to monitor, but because the June Acreage report raised planted area above the WASDE baseline and USDA already assumed abandonment near 23.4%, the market will likely need evidence that losses are exceeding USDA’s existing assumptions before materially tightening the new-crop balance sheet.

US Cotton Export & Sales
For the week ended June 25, 2026, current-crop upland net sales fell to 49,000 running bales, down 42% from the previous week and 70% below the four-week average. Vietnam was the largest buyer at 23,200 RB, followed by India at 7,400 RB, Pakistan at 5,900 RB, China at 5,500 RB, and Mexico at 2,600 RB. New-crop 2026/27 upland sales totaled 44,100 RB, led by Honduras at 11,300 RB, Guatemala at 9,300 RB, Turkey at 6,800 RB, Mexico at 5,200 RB, and Peru at 4,100 RB.
Shipments were less supportive this week. Upland exports fell to 218,800 RB, down 27% from the prior week and 22% below the four-week average. The leading destinations were Vietnam at 57,300 RB, Turkey at 49,800 RB, Pakistan at 31,600 RB, Bangladesh at 14,000 RB, and Mexico at 12,000 RB. Pima net sales were only 700 RB, a marketing-year low, while Pima exports rose to 24,400 RB, a marketing-year high.

On a 480-pound statistical-bale basis, all-cotton weekly current-crop sales totaled 51,200 bales, while shipments totaled 250,500 bales. Cumulative current-crop shipments reached 10.675 million bales, slightly ahead of last year’s 10.625 million at the same point. Total current-crop commitments stand at 12.705 million bales, about 505,000 bales above USDA’s 12.20 million-bale 2025/26 export forecast.

To reach USDA’s 12.20 million-bale export target, shipments need to average roughly 305,000 bales per week through the end of the crop year. This week’s 250,500-bale shipment pace was below that threshold, so the shipment cushion narrowed. Current-crop commitments remain more than sufficient on paper, but the market will need to see those commitments keep converting into physical shipments. New-crop all-cotton sales totaled 49,500 bales for the week, lifting cumulative 2026/27 commitments to 2.569 million bales.

Texas soil moisture deteriorated again in the NASS data. Texas topsoil rated short or very short increased to 51%, up from 47% the previous week, while subsoil rated short or very short held at 50%. Nationally, topsoil short or very short rose to 31%, up from 29%, while subsoil short or very short held at 35%.
The latest U.S. Drought Monitor data are somewhat less negative. Drought.gov data valid June 30 show 32.2% of Texas in D1-D4 drought, down from 35.7% in last week’s report. Severe drought or worse, D2-D4, stood at 12.8%, down from 13.7%. The improvement in mapped drought is helpful, but it has not yet prevented Texas cotton condition ratings and NASS soil-moisture readings from staying under pressure.
CPC’s latest 6-10 day outlook, covering July 13-17, favors above-normal temperatures for North and South Texas, near-normal temperatures for West Texas, and above-median precipitation across North, South and West Texas. Forecast confidence is 4 out of 5. The 8-14 day outlook, covering July 15-21, keeps the same Texas pattern: above-normal temperatures in North and South Texas, near-normal temperatures in West Texas, and above-median precipitation across all three regions. Forecast confidence is 3 out of 5.
NHC currently reports that tropical cyclone formation is not expected across the North Atlantic, Caribbean Sea or Gulf during the next 7 days.

Cotton On-Call
No major outlier in the latest Cotton On-Call report, other than the same issue as last week: An increase of 2,268 contracts in the unfixed call sales and still heavy concentration in the unfixed call purchases with 37,296 contracts in the new-crop December 2026 contract.

Outlook for Cotton
Bull Case
Texas stress is still supportive. Texas good/excellent fell to 36% from 39%; poor/very poor eased to 23%, but topsoil short/very short rose to 51% and subsoil held at 50%. U.S. good/excellent slipped to 46%.
Stocks and on-call remain friendly. USDA still shows 2026/27 U.S. ending stocks near 3.70m bales and world stocks at 71.1m, while Dec-26 unfixed call purchases jumped to 45,194 contracts.
Commitments stay ahead. Current-crop all-cotton commitments are 12.705m bales, about 505k above USDA’s 12.2m export target.
Bear Case
Rain is still the main cap. Texas D1–D4 drought fell to 32.2%, and NOAA’s 6–10 and 8–14 day outlooks favor above-median rainfall across Texas.
Supply base is larger. June Acreage put all-cotton plantings at 9.85m acres, up 6% y/y and about 2.2% above March; unchanged abandonment/yield would add roughly 0.3m bales versus June WASDE.
Sales cooled. Upland old-crop sales fell to 49,000 RB (-42% w/w), new-crop sales were 44,100 RB, and shipments dropped to 218,800 RB (-27% w/w).
Base Case
Cotton remains a weather market. U.S. crop is 49% squared / 14% setting bolls; Texas is 39% squared / 15% setting bolls.
December ~80.9c. Support 80/79.3c, then 77.3/76.3c; resistance 82.3/83.3c, then 85.3c.
[Bias this week: neutral-to-firm, two-sided. Constructive above 79–80c if Texas ratings keep sliding or rain misses; bearish if forecast rain verifies and Dec breaks back below 79c.
Coffee
Coffee Price Action
Arabica performed like SpaceX’s IPO with that price jump, settling at 349.95 on Jul 6; however, it reverted to 317.6 the following day. Changes not witnessed very often historically, a 48.75 cents rise from 301.2 for Jul 6 and a fall of 32.35 cents on the 7th. For some context, the annual high/low range in 2017, 2018, and 2020 was less than what the price did on Monday alone, +48.75 jump of +16.16%. September Arabica, as mentioned, settled at 317.6 on the day, while December settled at 305, leaving the U/Z spread at +12.6 c/lb. July settled at 331.60 with only 592 lots of open interest left, leaving the N/U spread at +14 c/lb.
Robusta did not follow suit, with September at 3,872 and November at 3,839, leaving U/X backwardation at +$33/t. The forward curve remains in steady backwardation, with the last contract month at 3,681. ICE Arabica stocks fell again to 366,756 bags, a fresh 2.25-year low, while Robusta certified stocks recovered to 697,500 bags. Initial margins for Arabica increased on Jul 6 from around 8,000 to 14,715 and then again on Jul 7 to 17,167.5. Exchanges increasing margins tends to dampen volatility in the short-term.
Technical Analysis
Strategic
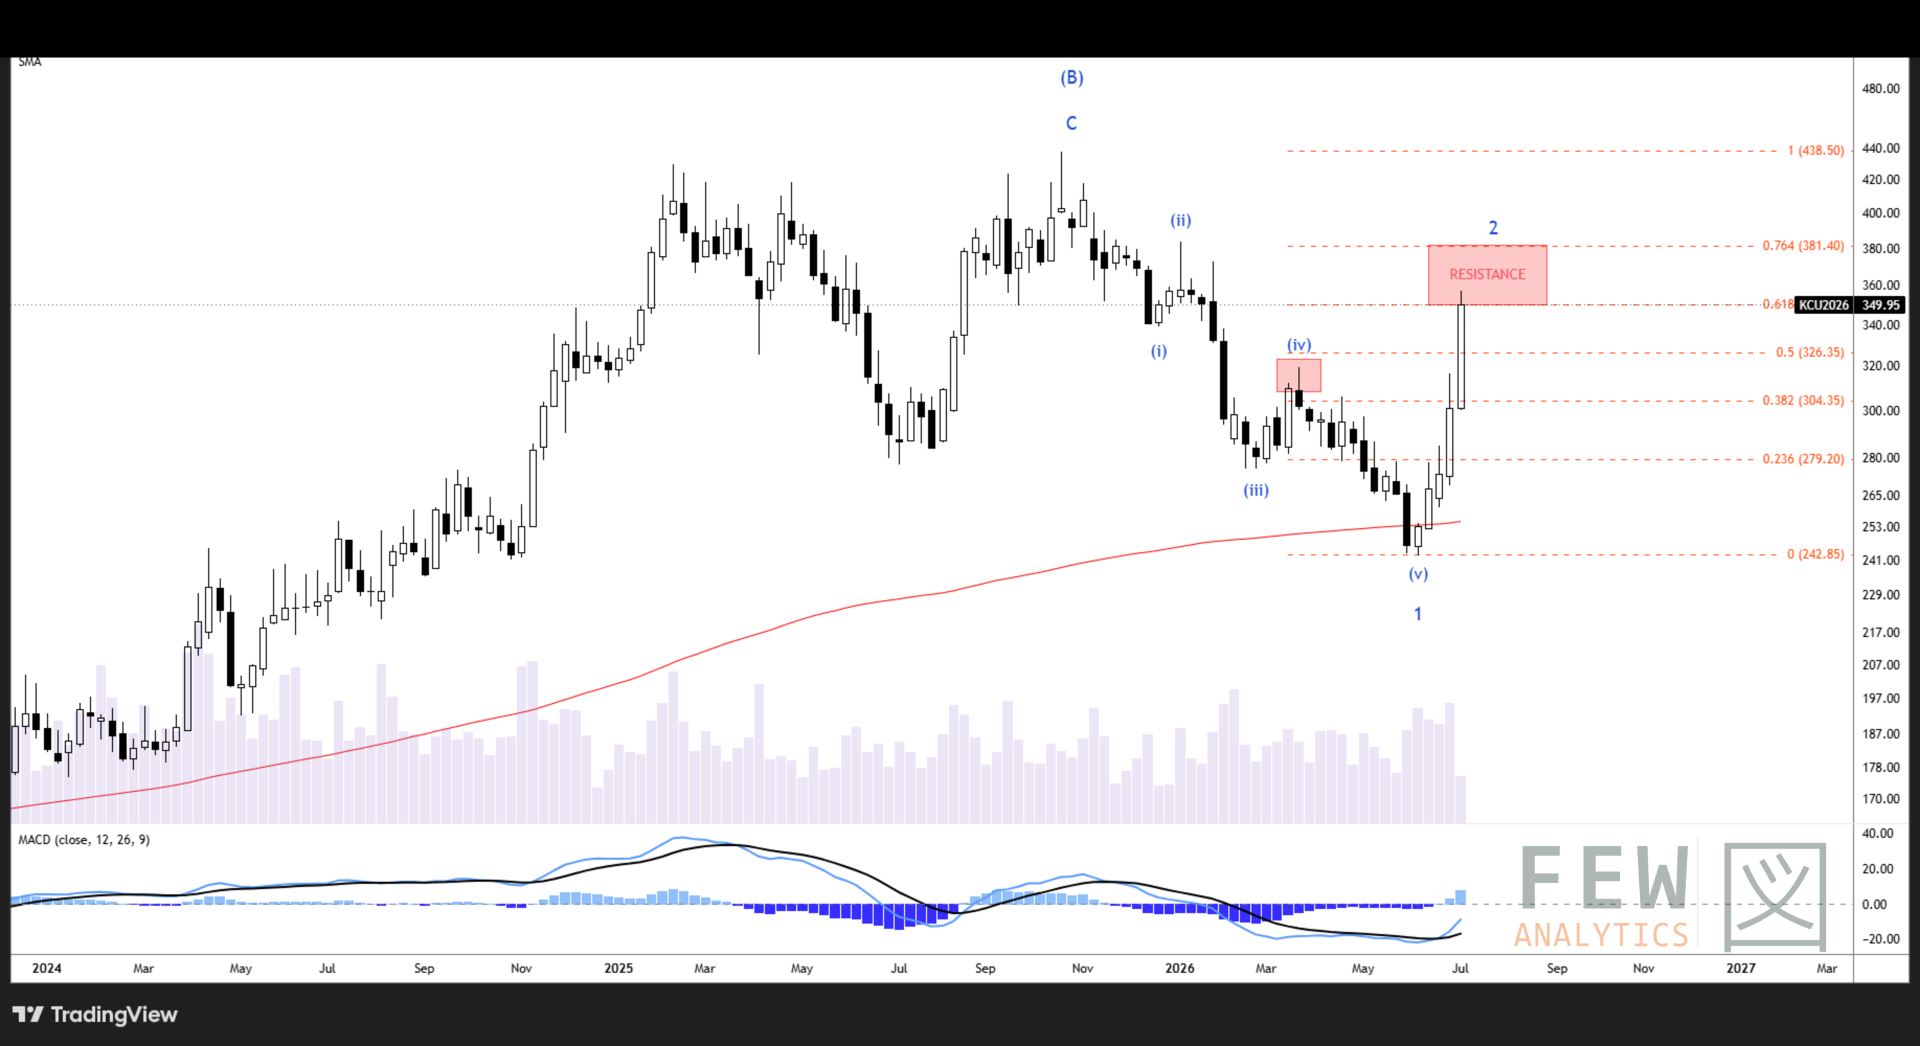
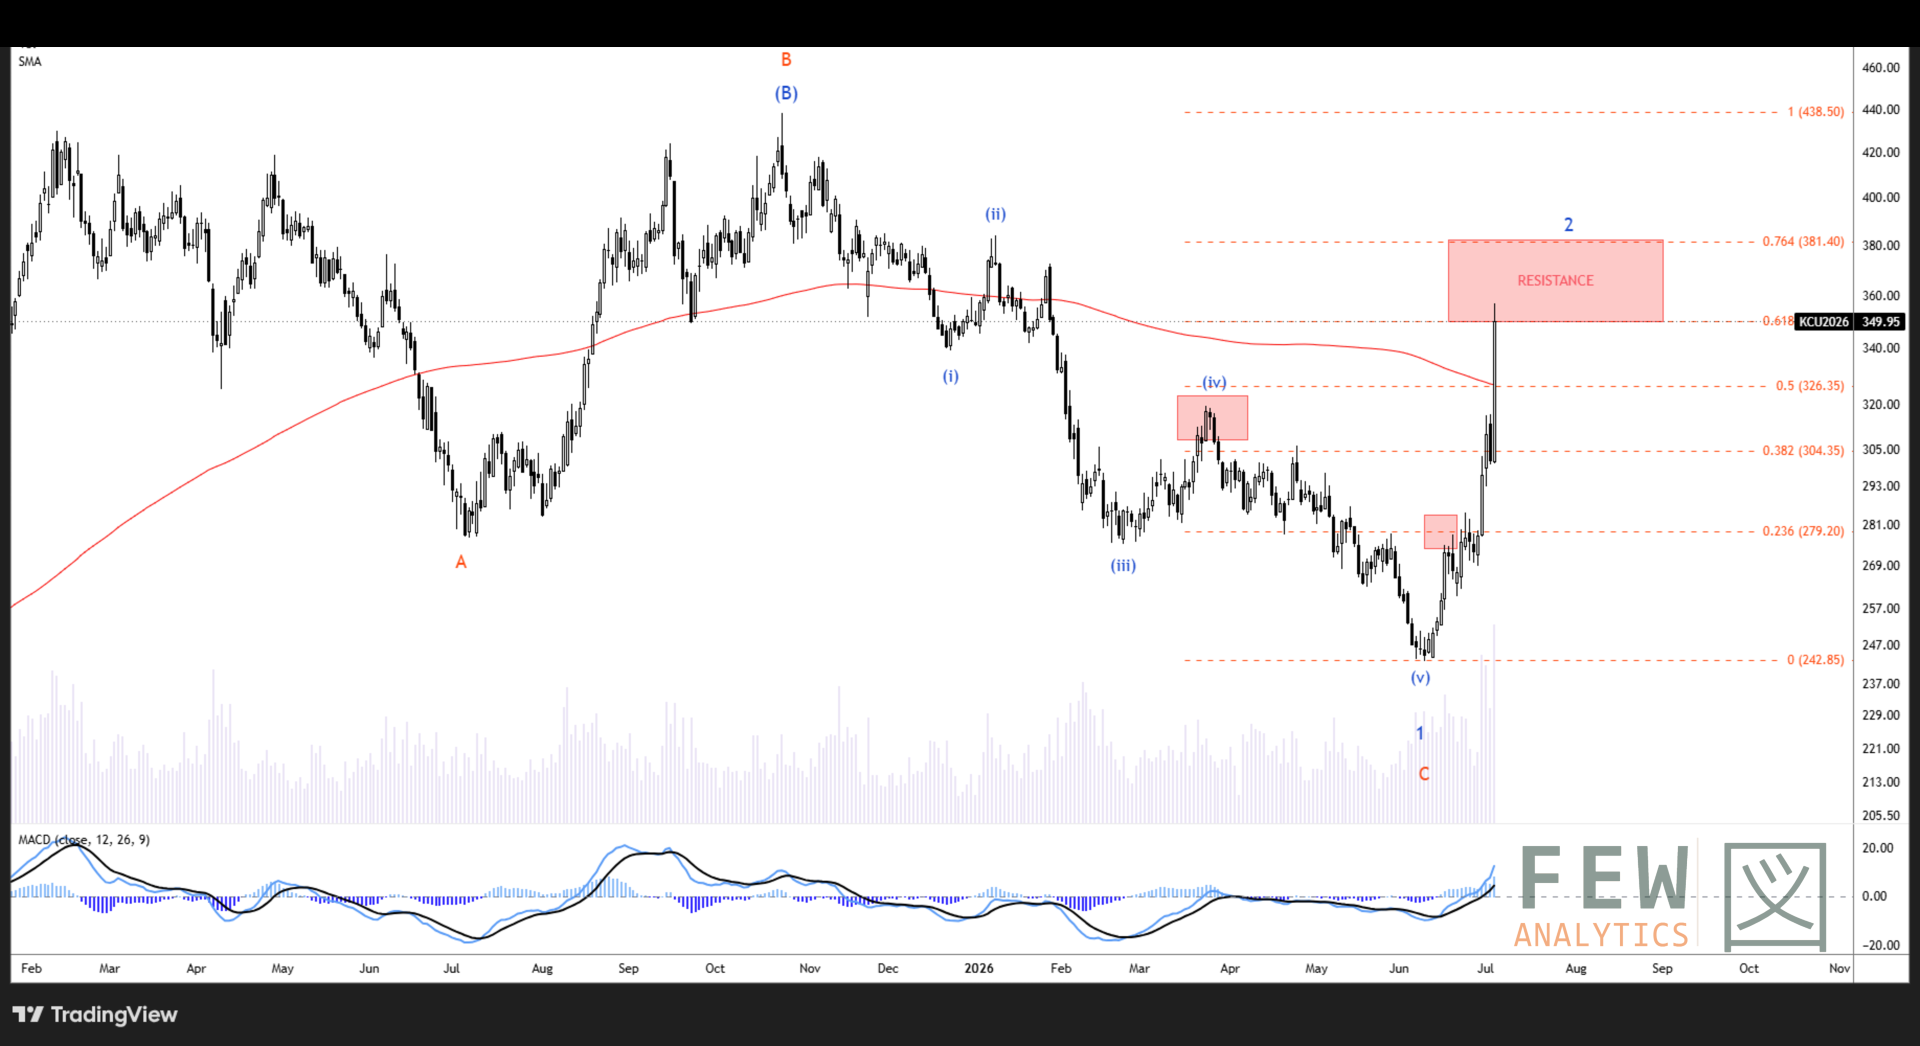
With the extreme spike this week above our invalidation area of 338, it's now clear KC is indeed further along in its wave count, with a wave (v) bottom formed a little below our target of 254. The key callout on the long-term chart now, is that this spike landed on the 0.618 retracement, which should ideally choke the rally if we truly are in a long-term decline as is our base case. There is also a lot of technical congestion up here: a lot of beans changed hands at these prices. Base case says this region will ultimately be left to the downside. However caution is warranted until we see some confirmation of a top in the micro analysis.
Tactical
KC has handed us the first real curveball since covering the market, with a blowout +16% move through resistance. This price action aligns to the base case as a wave 2 up in a bigger (C) wave decline. However, at present the micro structure is not ideal. In fact, this region is a great test of the base case, that KC is big picture bearish. The spike up can easily be counted as impulsive (not corrective). So we begin tracking a bullish alternate case in orange. This counts the action from 2025 as an ABC correction, implying higher targets to come. Something to watch.
Physical Pricing
Brazil differentials: We have rolled off the old-crop differentials, and NY 2 17/18 Fine Cup differentials for September and December now stand at 8 over Sept-26 and 8 over Dec-26, respectively. Also to mention,
NY 2/3 14/16 - Fine Cup stands at 10 under Sept-26 and 10 under Dec-26,
NY 2/3 15/16 - Fine Cup stands at 8 under Sept-26 and 8 under Dec-26,
Moka - (9/10/11) - Fine Cup stands at 13 under Sept-26 and 13 under Dec-26.

Certified stocks: Arabica continues to drop ~203,537k bags in the last 3 months, a 34.8% decrease, while Robusta remains steady currently around ~697k bags


Coffee Positioning
Arabica’s fund position continues to build, with managed money net long 21,223, up 7,221 from 14,002 the prior week. Longs rose 1,449 to 40,391 while shorts fell 5,772 to 19,168. The move was driven primarily by short covering, partly a response to the price rally during the week of the 29th.
Commercial accounts held a net short position of 20,024 contracts, with 49,163 longs and 69,187 shorts. The net short deepened by 5,659 from the previous week’s 14,365, a combination of both long liquidation (-2,945) and fresh shorts (+2,714), as commercials continue to build their net short position.
Robusta open interest rose 7,947 to 113,014 contracts. Commercials deepened their net short by 2,825 contracts, primarily from fresh shorts added. Managed money increased their net long position by 4,028 to 38,588 contracts. This was a mix from short covering (956 contracts) and additional longs (3,072 contracts).


Outlook
Bull Case
Nearby tightness is worse. ICE arabica stocks fell to 362,466 bags, a fresh 2.25-year low, while Brazil’s harvest is only 52% complete vs 60% last year and 55% average, keeping flow/quality risk live.
Positioning is less light, but not crowded. CFTC combined managed money is now net long 21,223 contracts, with the weekly rebuild driven mostly by short covering: shorts fell 5,772 lots while longs rose 1,449.
Front-end structure still supports squeeze risk. Sep/Dec remains inverted around +15.5c, and StoneX flags tight washed-arabica replacement plus decertification risk as key market supports.
Bear Case
The squeeze has already overshot. Sep arabica spiked to 357c Monday, then fell 32.35c / 9.24% Tuesday to 317.60c as margin hikes and profit-taking hit.
Brazil’s record crop still caps the move. USDA/FAS pegs 2026/27 Brazil output at 71.9m bags, while private estimates sit around 75.3–75.4m bags; bigger flows are expected from late Aug/Sep.
Robusta is a weak confirmation. ICE robusta stocks have recovered to 4,183 lots, a 3.5-month high, and Vietnam Jan–Jun exports are up 7.3% y/y to 1.05 MMT.
Base Case
Coffee remains tight nearby, looser forward, but the market is now post-squeeze rather than pre-breakout.
September ~318c. Support 304–300c, then 285–290c; resistance 335–350c, then the 357c blow-off high.
Bias this week: firm but fade strength. There is a squeeze risk while stocks sit near 362k bags and U/Z holds near +15.5c, but rallies into 335–350c should be sold unless Sep closes through 357c.


