
Summary
Key Takeaways:
Cotton remains a weather market, with deteriorating Texas conditions providing support, but higher U.S. planted acreage continues to cap rallies.
USDA's longer-term balance sheet remains constructive for cotton, though softer export sales and the need for clearer High Plains crop losses are limiting upside for now.
Brazil's record coffee crop is being offset by harvest delays and quality concerns, while tight certified stocks continue to support nearby prices.
Higher-for-longer U.S. interest rate expectations and a firmer U.S. dollar remain headwinds across commodity markets despite easing energy prices.
Coffee retains the stronger near-term upside on harvest disruption and tight inventories, while cotton still requires a more significant weather-driven catalyst to break higher.
TECHNICAL ANALYSIS
Read this week’s Technical Analysis here.
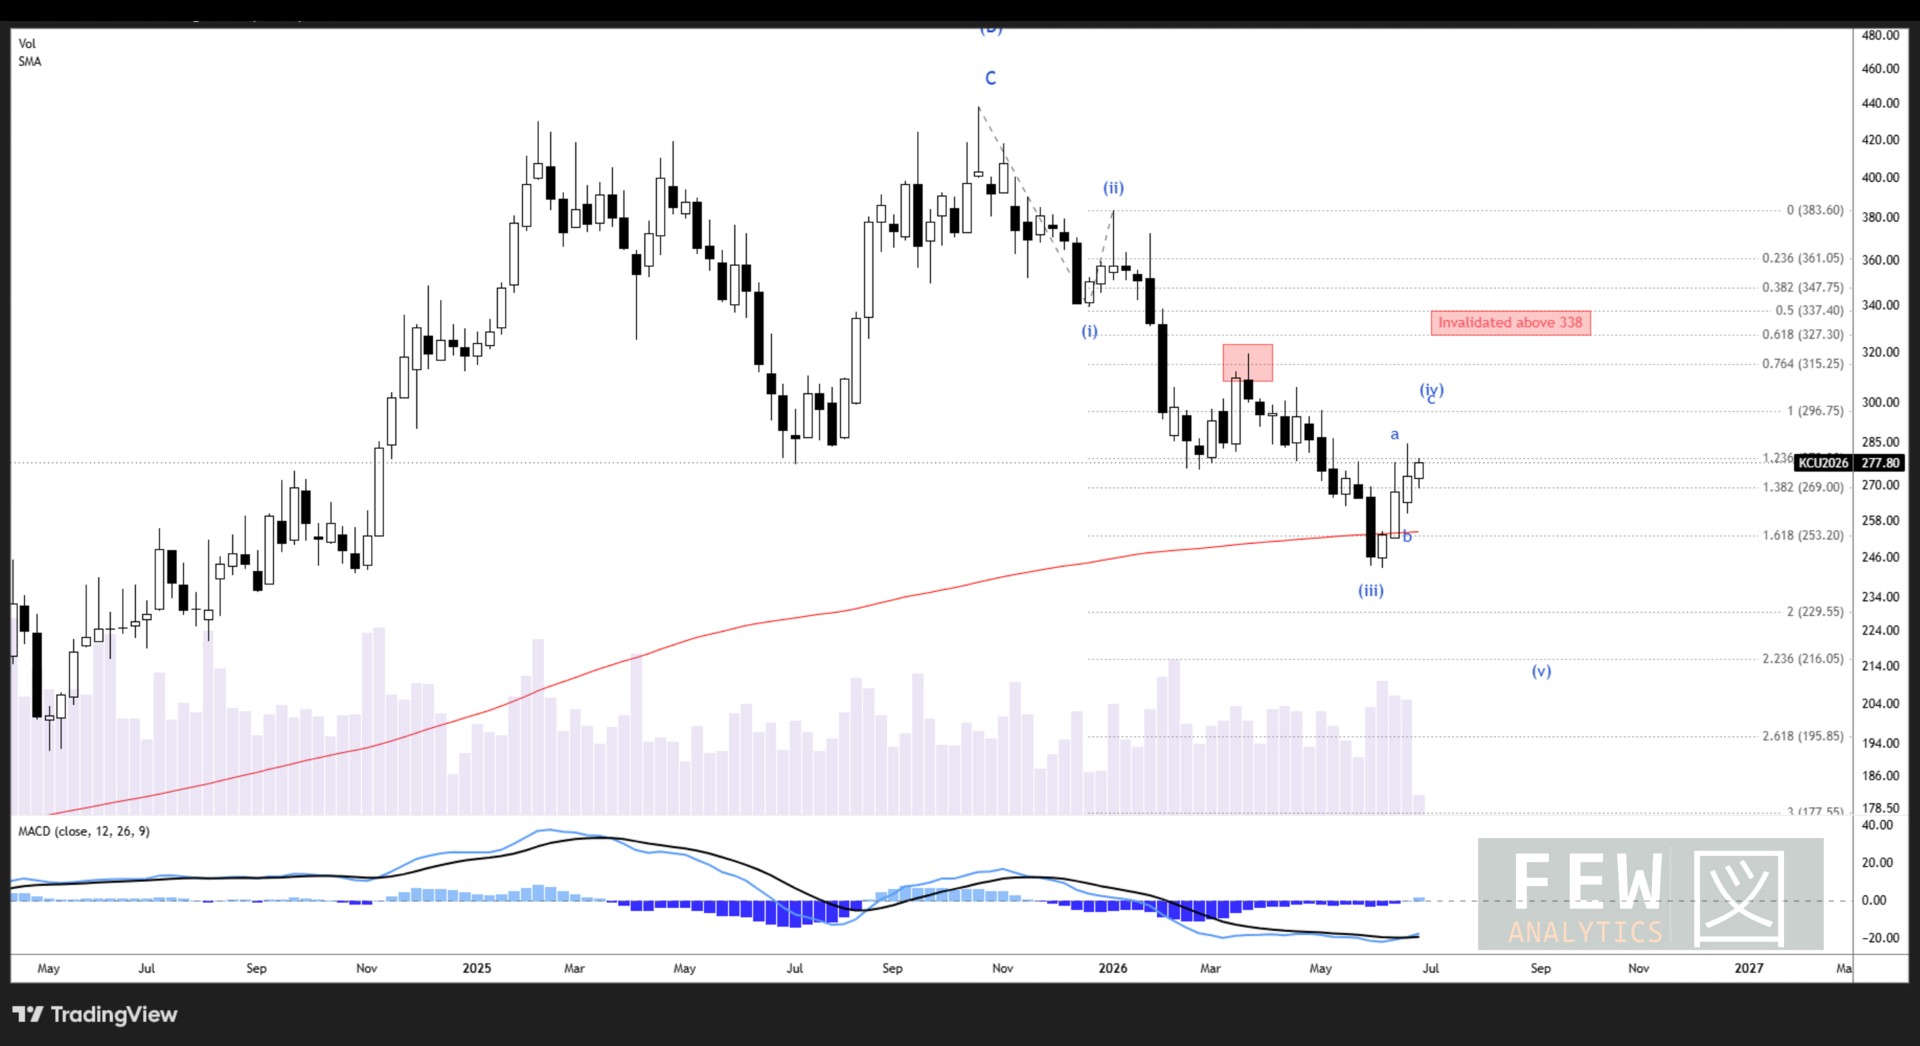
The key takeaways include:KC Arabica — base case unchanged within macro wave (C) lower, minimum target 215. The wave (iv) bounce is progressing toward 295–300, which we read as the short-entry zone for the coming wave (v) decline. The orange alternate count has been removed from the chart.
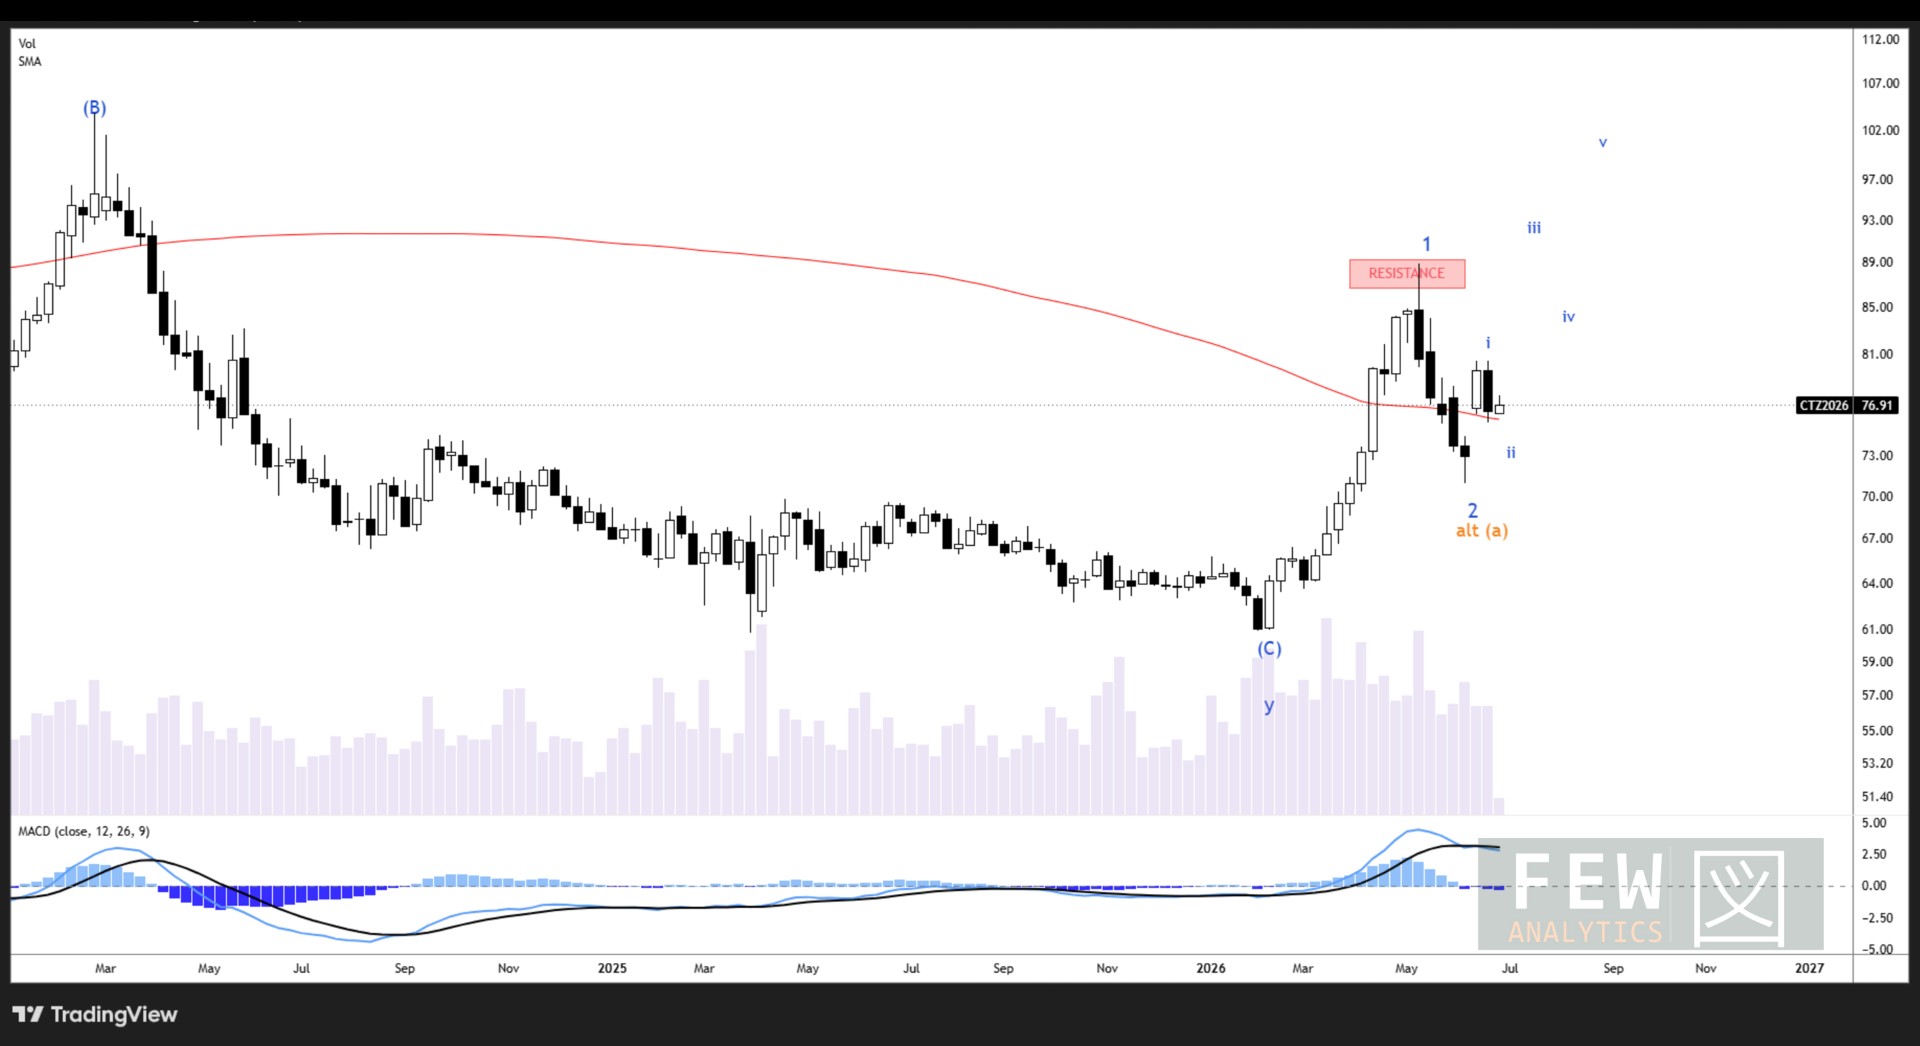
CT Cotton — long-term bullish structure firming, with waves 1 and 2 now in place as the opening of a larger five-wave advance. Wave 3 targets to be disclosed once a break above the 2026 high (89) is in.
If you want to understand the charts further, you can read about how to interpret them here.
Cotton remains a weather market, but this week added more supply-side caution rather than a clean bullish trigger. Planting reached 97% by June 28, matching the five-year average, while squaring rose to 37%, slightly ahead of normal, and boll setting reached 9%, in line with average. Conditions slipped, with national good/excellent falling to 48% from 53%, while poor/very poor rose to 16%. Texas remains the key risk: it is now 95% planted, with 32% squaring and 11% setting bolls, but condition deteriorated to 39% good/excellent and 25% poor/very poor. The June acreage report was an added cap, with all-cotton plantings at 9.85m acres, up 6.1% from last season and 2.2% above the prior estimate. December cotton is closer to 76.8c/lb, so the board still needs visible High Plains deterioration or abandonment risk to break higher.
USDA’s 2026/27 world balance sheet still gives cotton a supportive longer-term story, with production at 116.0m bales versus mill use of about 121.8m, and ending stocks still pointed lower toward 71.1m bales. Weekly U.S. demand was softer on sales but better on movement: Upland sales fell to 83,900 RB, down sharply from the prior week, while shipments improved to 300,200 RB. Supportive overall, but not yet strong enough to offset higher acres and a board that still wants proof of Texas or High Plains losses.
Brazil remains the coffee market’s record-crop anchor, but the nearby trade has shifted more decisively toward harvest-disruption risk. USDA/FAS puts Brazil’s 2026/27 crop at a record 71.9m bags, while private estimates remain around 75.4m–75.65m bags. Rain has disrupted fieldwork and drying in Brazil’s producing regions, especially Minas Gerais, increasing flow and quality risk. September arabica rallied to around 296c/lb, while certified arabica stocks fell to about 377,000 bags, a 2.25-year low; robusta stocks recovered to around 4,053 lots after recently hitting a two-year low. The big Brazil crop still caps rallies, but tight certified stocks and wet-harvest risk keep squeeze risk alive.
Macro
Macro stayed a headwind this week, even as the energy impulse faded. Brent eased to about $73/bbl, trimming the polyester-cost floor under cotton, while the U.S. 10-year yield held near 4.46% and the dollar index sat around 101.24. The bigger story sits in rates, where the market has spent 2026 teared up the easing cycle.

Back in late February the strip priced a easing cycle: from a spot rate near 3.64%, the fed funds path sloped down to a 2.86% terminal by December 2027, some 78bp of cuts. By July that view had fully reversed. The curve now prices hikes instead, peaking near 4.05% in April 2027 before settling at a 3.89% terminal. The inflection came between the April and May snapshots.

The dollar tracked the repricing. As the market swapped cuts for hikes, the DXY firmed steadily, up 2.5 points from February to March and +3.6 points by July, from 97.6 to 101.2 (+3.7%). Over the same window the 10-year yield climbed from 4.25% to 4.46%, while 2s10s flattened from roughly 53bp to 29bp, a front-end-led selloff, and exactly the shape you get when the market leans higher-for-longer.

Fed funds futures now price roughly a 65% chance of a hike by September, keeping financial conditions restrictive. Net-net across the board: cotton still needs a clear Texas weather break and coffee can squeeze higher on harvest disruption and frost risk, but both stay vulnerable while yields and the dollar hold firm.

Cotton
Cotton Price Action
ICE cotton failed to hold the previous week’s rebound during the week ended Friday, 26 June. July 2026 closed at 71.66 c/lb, December 2026 at 76.38 c/lb and March 2027 at 77.74 c/lb. Against the 18 June holiday-week reference, the contracts lost 439, 329 and 331 points respectively. That more than erased the previous week’s recovery in July and left the deferred contracts effectively back near the 12 June base: December was 4 points below that reference and March only 10 points above it. The move was therefore broader than a simple nearby-roll adjustment, even though the July contract remained the weakest part of the board.
By Tuesday, 30 June, part of the late-week break had been recovered. July settled at 72.22 c/lb, December at 76.80 c/lb and March at 78.14 c/lb, up 56, 42 and 40 points respectively from Friday. October, now the cleaner nearby reference, settled at 74.99 c/lb. Even after that bounce, however, July, December and March remained 383, 287 and 291 points below their 18 June levels. Relative to the 12 June closes, July was 72 points lower, while December and March were only 38 and 50 points higher, respectively.
The July contract should now be treated with caution as a price signal. ICE lists 24 June as first notice day for July 2026, and by 30 June July showed only 6 contracts of volume and 72 contracts of open interest, compared with 21,992 contracts of volume and 200,459 contracts of open interest in December. The July weakness therefore increasingly reflects delivery, liquidation and illiquidity rather than the underlying tone of the active cotton curve.
The broader cotton benchmark was quoted at 76.76 c/lb on 30 June, up 0.41% on the day but only 0.16% higher over the preceding month. That leaves the rolling monthly comparison almost flat rather than clearly constructive. Prices remain well below the May highs, with the December contract’s three-month high shown at 88.08 c/lb on 13 May, and the market still has not reclaimed the former 82 to 84 c/lb breakout area.
Spot indicators also softened. USDA’s Weekly Cotton Market Review showed seven-market spot quotations averaging 70.84 c/lb for the week ending 25 June, down 28 points from 71.12 c/lb the previous week but still above 65.05 c/lb a year earlier. Daily averages ranged from a high of 72.68 c/lb on 22 June to a low of 69.28 c/lb on 24 June. Spot transactions dropped sharply to only 592 bales, compared with 8,586 bales the prior week and 4,132 bales in the corresponding week last year. Season-to-date spot transactions stood at 1.516 million bales, still well above 974,340 bales a year earlier. USDA’s October futures reference ended the review week at 75.17 c/lb, down from 79.24 c/lb the previous week.
Tuesday’s modest recovery came despite USDA’s June acreage report showing all-cotton planted area at 9.85 million acres, above trade expectations of 9.6 million acres and above the March figure of 9.64 million acres. Crop condition deterioration offered some offsetting support: weekly Crop Progress data showed 37% of the U.S. crop squared, 9% setting bolls and good/excellent ratings down 5 percentage points on the week to 48%.
The overall message is therefore less constructive than last week. The prior rebound has largely failed, cash quotations eased, spot trading activity collapsed, and the active futures months remain well below the 82 to 84 c/lb resistance zone. The late-June bounce in October, December and March suggests some stabilization after Friday’s washout, but not a confirmed recovery. Current weakness is still exaggerated in the expiring July contract, but the broader curve has also lost enough ground that the market now needs a stronger close back above the mid to upper 70s, and eventually a move through 82 to 84 c/lb, to restore a bullish technical tone.
Technical Analysis:
Strategic
Cotton presents a long-term bullish chart at this juncture, with the base case being wave 1 and wave 2 now in place as the opening of a larger five-wave move higher. Should this base case play out, we would see much higher cotton prices, above the 2026 high of 89. CT is currently working on the sub-waves that would fuel such a breakout.
Tactical
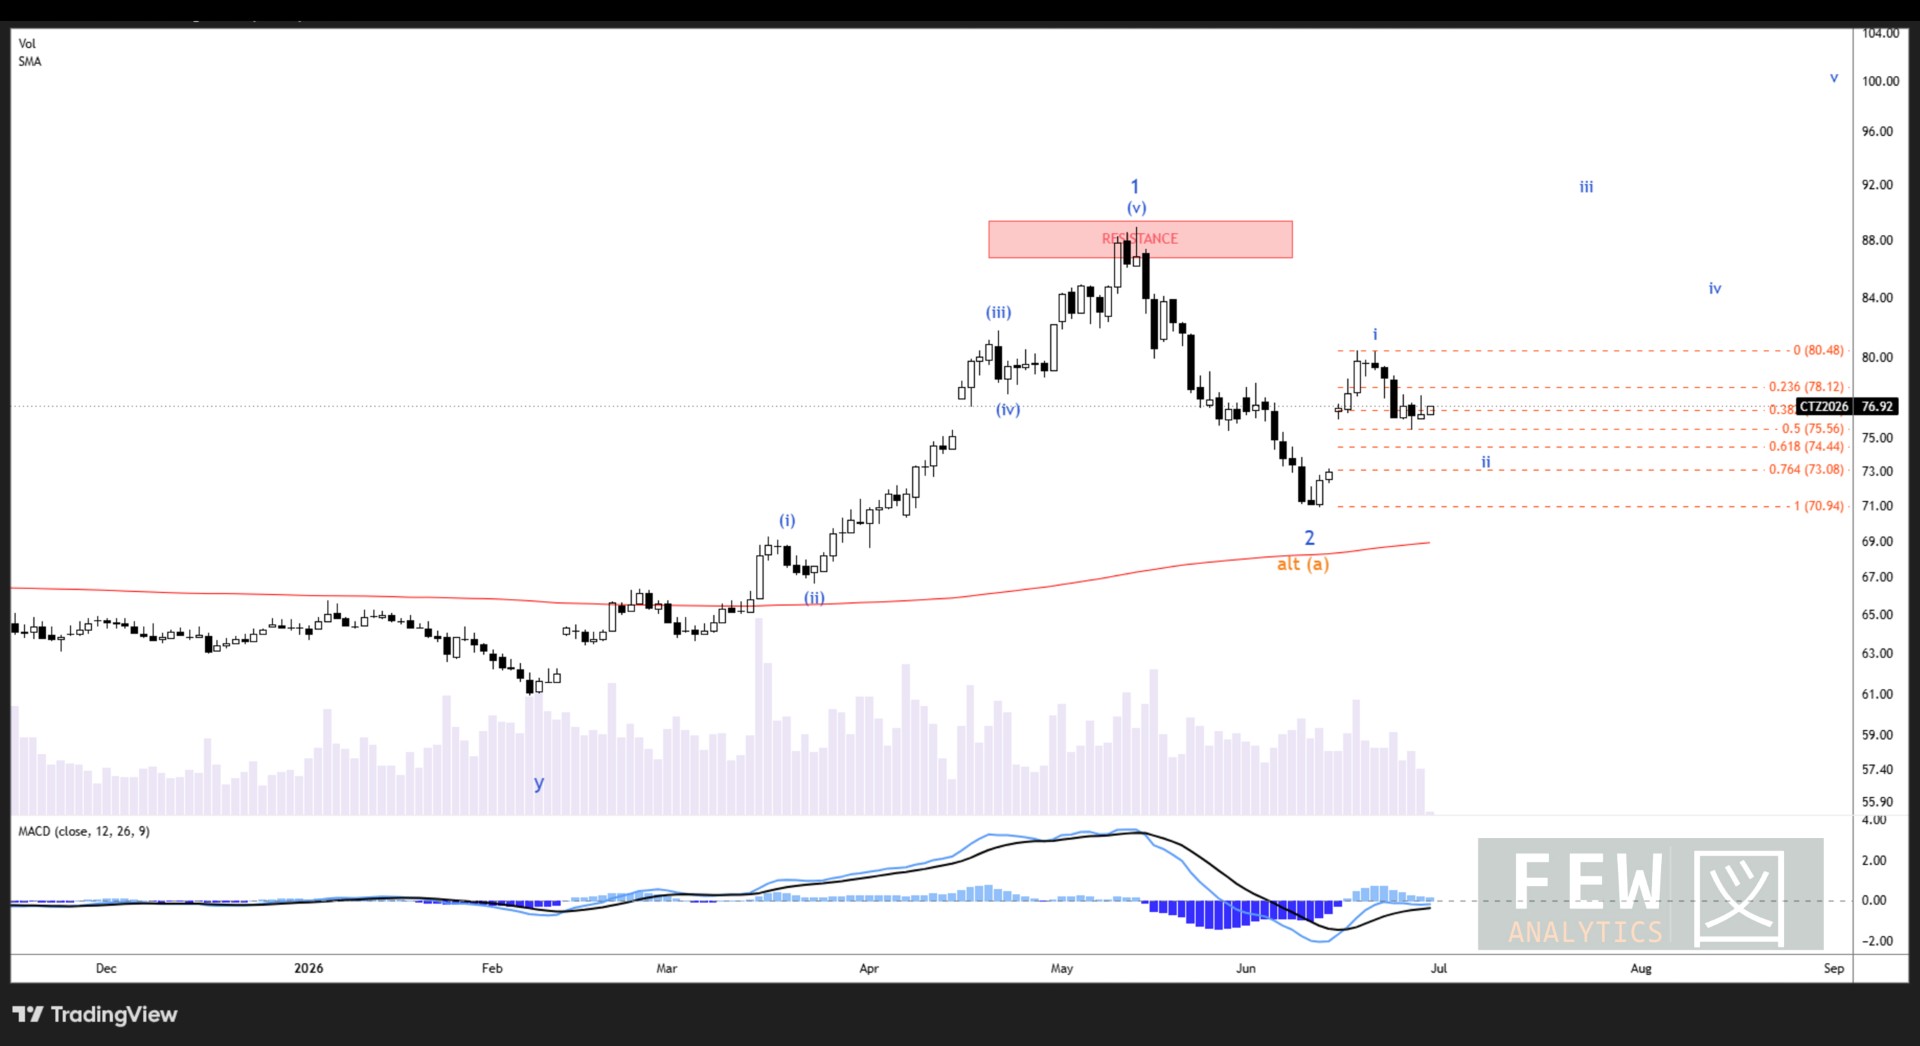
Cotton moved to convince us wave i completed at 80.40, producing a decline to the 50% retracement over the week. This is enough to complete wave ii; however, we prudently remain vigilant of a lower low toward 74.40 at the 0.618 retracement. Once wave ii is confirmed complete, we expect wave iii to take out the high, as a vanguard of the bigger wave 3. Once we see a break above the 2026 high, we can disclose wave 3 targets, but not until we see evidence the base case is accurate.
Cotton Positioning
CFTC data for 23 June reported managed money net long of 38,445 contracts, comprising of 63,927 longs and 25,483 shorts. Revealed an increase of 3,309 from 35,136 the previous week.
The increase reflected short covering shown by a drop from 28,279 to 25,482 shorts. Funds remain long despite the bearish short covering.
Commercial accounts held 66,595 shorts and 183,577 longs, leaving them net short 166,982 contracts, which was a 3,085 fall from the previous week. Reduction in longs by 4,445 and only a 1,360 drop in shorts.
Open interest fell by 1,847 and sat at the 96th percentile which means it has been above this level only 4% of the time, over the last 20 years, market is large and liquid. Gross commercial shorts remain 43.2% of open interest, however latest move shows derisking rather than short covering.

Balance sheet
USDA’s U.S. cotton balance remains heavy, and the June Acreage report slightly offsets the more supportive tone of the June WASDE. In the June WASDE, USDA raised 2025/26 exports to 12.20 million bales, lowered domestic use to 1.55 million bales, and reduced ending stocks to 4.20 million bales, leaving stocks-to-use near 31%. For 2026/27, USDA left production, exports and domestic use unchanged at 13.30 million, 12.30 million and 1.60 million bales, respectively, while ending stocks fell to 3.70 million bales due to the smaller old-crop carry-in. New-crop stocks-to-use consequently declined to roughly 26.6%–27.0%. The lower carryout is supportive, and USDA continues to forecast a 2026/27 farm price of 73 cents/lb, compared with 63 cents/lb in 2025/26. Nevertheless, supplies remain comfortable enough that a sustained rally likely still requires additional support from weather, yield loss or stronger demand.
The main new development is the June Acreage report. NASS estimated 2026 all-cotton planted area at 9.85 million acres, up 6.1% from 2025 and 2.2% above the March Prospective Plantings survey, which had indicated 9.64 million acres. Upland cotton area was estimated at 9.70 million acres, while Pima was estimated at 150,000 acres. The June report was based on a survey of about 90,300 farm operators in early June, compared with the March intentions survey of nearly 74,000 operators.
The acreage increase is mildly bearish relative to the June WASDE baseline because the June balance sheet was still built off the March planted-area assumption. USDA’s June WASDE used 9.64 million planted acres and about 7.38 million harvested acres, implying abandonment near 23.4%–23.5%. The Acreage report did not yet provide a harvested-area estimate for cotton, so the supply impact depends on how USDA handles abandonment and yield in the next balance sheet. If USDA applied the same roughly 23.5% abandonment assumption to the new 9.85 million-acre planted estimate, harvested area would rise to about 7.54 million acres. At USDA’s June yield assumption of 866 lb/acre, that would imply production near 13.6 million bales, roughly 0.3 million bales above the June WASDE forecast. Conversely, keeping harvested acreage near 7.38 million acres would require implied abandonment to rise to about 25.1%.
The regional mix also matters. Versus the March survey, Texas was reduced to 5.425 million acres, down 1.7% from March but still 2.0% above last year. However, several lower-abandonment Delta and Southeast states increased sharply: Georgia rose to 1.0 million acres, up 11.1% from March; Mississippi rose to 430,000 acres, up 43.3%; Alabama rose to 360,000 acres, up 24.1%; and Kansas rose to 120,000 acres, up 20.0%. This means West Texas dryness alone may not be enough to tighten the balance sheet unless stand losses, abandonment or yield deterioration exceed what USDA already assumed and offset the larger June acreage base.
The global outlook remains more constructive than the U.S. balance sheet. USDA projects 2026/27 world production at 116.04 million bales, below consumption of nearly 121.8 million bales, with global ending stocks declining to 71.13 million bales, the lowest level in eight years. However, Brazil remains a formidable export competitor. USDA forecasts Brazil’s 2026/27 crop at 17.50 million bales and exports at a record 15.00 million bales, equal to roughly 34.5% of world trade, compared with U.S. exports of 12.30 million bales, or about 28.5% of global trade.
U.S. export shipments remain supportive, but sales cooled sharply from the prior week. For the week ended June 18, old-crop upland sales were 83,900 running bales, down 53% from the previous week and 54% below the four-week average, led by Vietnam, India, Bangladesh, China and South Korea. New-crop upland sales were 67,100 running bales, primarily to China, Guatemala, Vietnam, El Salvador and Indonesia. Shipments were stronger at 300,200 running bales, up 20% week over week and 6% above the four-week average, led by Vietnam, Pakistan, Bangladesh, Turkey and India. The shipment pace continues to support USDA’s June old-crop export increase, but the latest sales data were less constructive than the prior week.
Planting Progress
USDA/NASS’s latest Crop Progress report shows U.S. cotton planting essentially complete and now back on normal pace. As of the week ended June 28, the crop was 97% planted, up from 92% a week earlier, ahead of last year’s 95% and equal to the 5-year average of 97%. Texas reached 95% planted, up from 90%, ahead of last year’s 94% but still two points behind the 5-year average of 97%.
Crop development remains broadly on schedule. Nationally, 37% of the crop was squaring, up from 27% a week earlier, slightly behind last year’s 38% but just ahead of the 5-year average of 36%. Texas was 32% squaring, up from 25%, below last year’s 35% but equal to the 5-year average. Boll setting reached 9% nationally and 11% in Texas, with both readings matching their respective 5-year averages.

Condition Report
The condition report deteriorated, particularly in Texas. Nationally, U.S. cotton was rated 48% good/excellent, down from 53% last week and below last year’s 51%. Fair rose to 36% from 34%, while poor/very poor increased to 16% from 13%, roughly in line with last year’s 17%.
Texas conditions weakened more clearly. The crop was rated 39% good/excellent, down from 44% last week, while fair held at 36%. Poor/very poor increased to 25% from 20%. The Texas distribution is no longer merely polarized; it is tilting weaker. That gives the market a weather-risk story to monitor, but because the June Acreage report raised planted area above the WASDE baseline and USDA already assumed abandonment near 23.5%, the market will likely need evidence that losses are exceeding USDA’s existing assumptions before materially tightening the new-crop balance sheet.

US Cotton Export & Sales
For the week ended June 18, 2026, 2025/26 upland net sales totaled 83,900 RB, down 53% from the prior week and 54% below the four-week average. Vietnam was the largest buyer at 31,300 RB, followed by India at 14,300 RB, Bangladesh at 14,200 RB, China at 7,600 RB and South Korea at 4,500 RB. New-crop 2026/27 upland sales totaled 67,100 RB, led by China, Guatemala, Vietnam, El Salvador and Indonesia.
Shipments improved on the upland side. Upland exports increased to 300,200 RB, up 20% from the previous week and 6% above the four-week average, with Vietnam, Pakistan, Bangladesh, Turkey and India the leading destinations. Pima net sales totaled 4,300 RB, while Pima exports fell to 7,800 RB, down 41% from the prior week and 50% below the four-week average.

On a 480-pound statistical-bale basis, all-cotton weekly sales totaled 90,800 bales, while shipments totaled 317,200 bales. Cumulative current-crop shipments reached 10.425 million bales, essentially even with last year’s 10.427 million at the same point. Total current-crop commitments stand at 12.654 million bales, about 454,000 bales above USDA’s 12.2 million-bale 2025/26 export forecast.

To reach USDA’s 12.2 million-bale target, shipments need to average roughly 296,000 bales per week through the end of the crop year. This week’s 317,200-bale shipment pace was above that threshold, adding a modest cushion.
New-crop demand cooled from the prior week but remains constructive. All-cotton 2026/27 sales totaled 69,100 bales for the week, lifting cumulative new-crop commitments to 2.520 million bales. The forward book continues to build, though the latest week was much less aggressive than the previous week’s surge.

Texas soil moisture deteriorated again. Texas topsoil rated short or very short increased to 47%, up from 42% the previous week, while subsoil rated short or very short increased to 50%, up from 48%. Nationally, topsoil short or very short improved to 29% from 31%, while subsoil improved to 35% from 36%.
Texas cotton development advanced, with planting at 95%, squaring at 32% and setting bolls at 11%. Texas cotton condition slipped to 39% good/excellent and 25% poor/very poor, compared with 44% good/excellent and 20% poor/very poor a week earlier.
The latest U.S. Drought Monitor shows 35.7% of Texas in D1-D4 drought, down from 40.1% previously. Severe drought or worse declined to 13.7%, down from 16.7%. Tropical Storm Arthur and related tropical moisture brought drought relief but also local flooding, with broad one-category improvement noted from eastern Texas into the central Gulf Coast region.
CPC’s latest 6-10 day outlook, covering July 6-10, places North, South and West Texas in the above-normal temperature category, with above-median precipitation also favored. Forecast confidence is 3 out of 5.
The 8-14 day outlook, covering July 8-14, keeps North, South and West Texas in the above-normal temperature category and maintains above-median precipitation across all three Texas regions. Forecast confidence is 2 out of 5, reflecting higher model uncertainty.
NHC currently reports no Atlantic tropical cyclones, and tropical cyclone formation is not expected across the North Atlantic, Caribbean or Gulf during the next seven days

Cotton On-Call
No major outlier in the latest Cotton On-Call report, other than the same issue as last week: An increase of 2,268 contracts in the unfixed call sales and still heavy concentration in the unfixed call purchases with 37,296 contracts in the new-crop December 2026 contract.

Outlook for Cotton
Bull Case
Texas conditions are deteriorating. Texas good/excellent fell to 39% (from 44%) and poor/very poor rose to 25% (from 20%), while Texas topsoil short or very short climbed to 47% and subsoil to 50%. Sustained stress lifts abandonment and yield risk.
Stocks stay supportive. USDA projects 2026/27 U.S. ending stocks at 3.70m bales (new-crop stocks-to-use ~26.6–27.0%) and world ending stocks at 71.1m bales, an eight-year low, with production (116.0m) below consumption (~121.8m).
Shipments and latent demand impress. Upland exports jumped to 300,200 RB (+20% w/w); current-crop commitments reached 12.654m bales, about 454k above USDA’s 12.2m-bale target, with a heavy 37,296 unfixed call purchases stacked in Dec-26.
Bear Case
Rain is the main bearish trigger. Texas drought eased to 35.7% in D1–D4 (from 40.1%), Tropical Storm Arthur brought relief, and the 6–10 and 8–14 day maps favor above-median rainfall across Texas, deflating weather premium.
The supply base grew. The June Acreage report put all-cotton plantings at 9.85m acres (+6.1% y/y, +2.2% above March); holding USDA’s ~23.5% abandonment would lift production about 0.3m bales above the June WASDE.
Sales cooled and the board is capped. Old-crop upland sales fell to 83,900 RB (-53% w/w), new-crop sales slowed to 67,100 RB, and December (~76.8c) remains well below the 82–84c breakout.
Base Case
Cotton stays a weather market; with planting essentially done (97%, Texas 95%), the story now turns on Texas conditions and abandonment versus USDA’s assumptions.
December ~76.8c. Support 75–76c, then 74.40c (0.618 retracement); resistance 78c, then 80–81c, then the 82–84c breakout.
Bias this week: neutral, two-sided. Constructive if Texas heat and dryness persist or ratings keep sliding; bearish if the forecast rain verifies and December breaks 75c.
Coffee
Coffee Price Action
Coffee’s front end remains split, but the move is now more clearly arabica-led rather than a simple arabica/robusta divergence. September arabica settled at 296.45, up 18.65 cents on the day, while December settled at 282.10, leaving the U/Z inverse at +14.35 c/lb. July settled at 311.20 with only 874 lots of open interest left, so the N/U inverse is +14.75 c/lb, but that nearby spread is increasingly delivery-thin rather than a clean screen signal. Robusta followed the weather rally in flat price, with September at $3,658 and November at $3,612, but the U/X inverse of about $46/t is not confirming arabica’s front-end tightness. ICE arabica stocks fell again to 377,465 bags, a fresh 2.25-year low, while robusta certified stocks recovered to 4,053 lots.
Technical Analysis:
Strategic
Arabica continues to follow the path set out in prior GSX commentary, within macro wave (C) lower. Action over the past week aligns to our base case as this being wave (iv) up, leaving the alternate scenario — a larger degree bottom in alt (v) — less probable. From here we expect KC to chop higher towards 300 before commencing the wave (v) decline toward 215.
Tactical
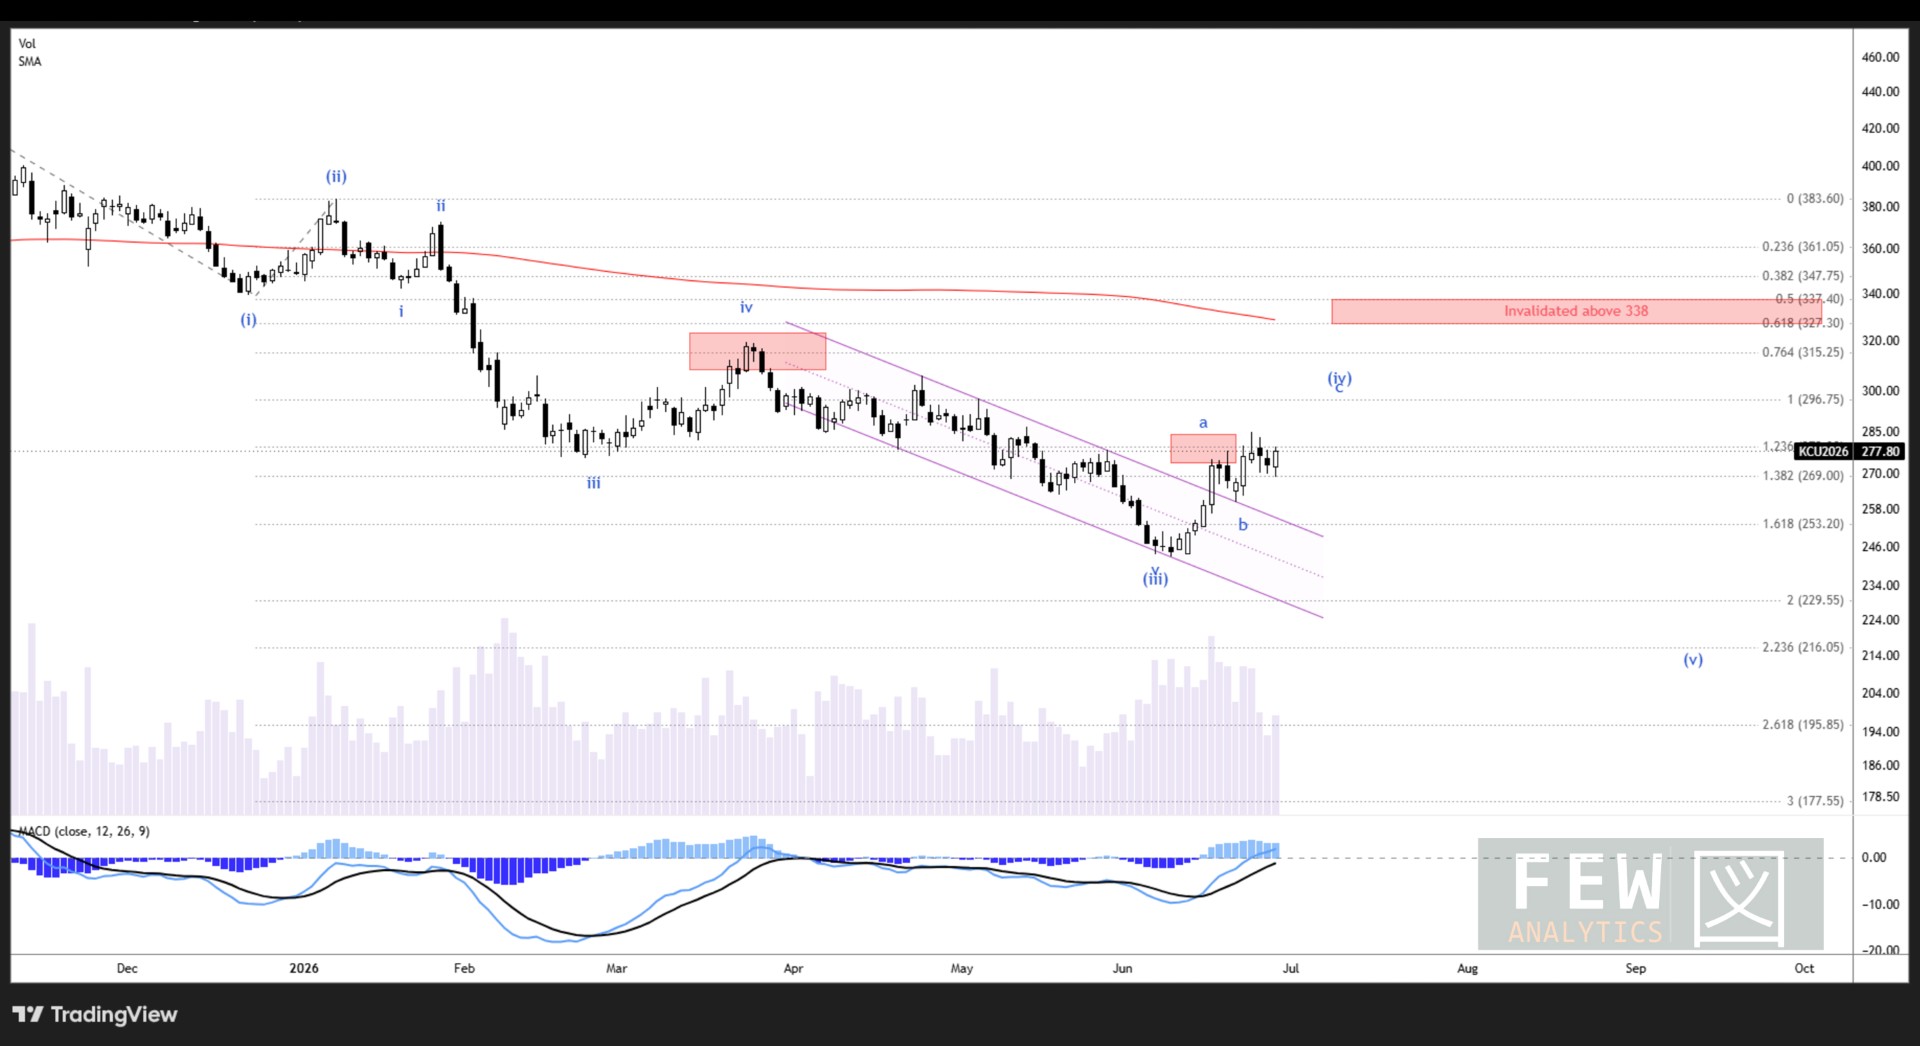
Over the week KC delivered the breakout from the downtrend channel outlined in last edition’s tactical notes. We also saw a clean rejection from our red resistance box at 280, playing out cleanly as waves a and b. Thus far the b-wave has found support at the top of our channel. With those moves in the bag, we can fairly confidently project wave c of (iv) toward the 295–300 target, using Fibonacci confluence in that region.
Physical Pricing
Brazil differentials: We have rolled off the old-crop differentials, and Fine Cup differentials for September and December now stand at -6 over September and -6 over Dec-26, respectively. This is a positive signal for the market outlook.

Certified stocks: Arabica dropped ~203,537k bags in the last 3 months, a 34.8% decrease, while Robusta remains steady currently around ~676k bags


Coffee Positioning:
Arabica’s fund position almost doubled over the past week, strong increase. Managed money jumped from 7,974 to 14,002 net long position. It was a double hit with increased longs of 3,416 contracts and a decrease in shorts of 2,612 contracts.
The jump was driven by an increase in longs and a short covering. Primarily from managed money exiting positions which saw a short rally last week and resulted in a bullish squeeze of short coverings.
Commercial accounts held a net short position of 14,365 contracts, with 52,108 long contracts and 66,473 short contracts. A decrease of 4,850 from the previous week’s net short of 9,515 contracts.
Robusta open interest dropped by 24,037 to 105,067 contracts. Driven by commercials long liquidation - longs dropped to 20,194 from previous week’s 27,938 contracts. Commercials went more net short in one week, both by adding shorts of 590 contracts and cutting longs by 7,744 contracts.


Outlook:
Bull Case
Nearby tightness is intensifying. ICE arabica certified stocks fell to 377,465 bags, a fresh 2.25-year low (down ~34.8% in three months), while wet-harvest disruption in Minas Gerais adds flow and quality risk, keeping squeeze risk live.
Positioning is still light. Managed money net length is only 7,974 contracts, and the week’s rebuild came mostly from short covering, leaving room for fresh spec buying to extend the move.
Front-end structure is firm. The Sept/Dec inverse holds at +14.35 c/lb and Brazil Fine Cup differentials tightened to -6 over (Sept and Dec), a supportive physical signal.
Bear Case
Brazil’s record crop caps rallies. USDA/FAS pegs the 2026/27 crop at 71.9m bags, with private estimates up to 75.4–75.7m bags, a large overhang against any weather bounce.
Robusta is not confirming. Robusta certified stocks recovered to 4,053 lots and the Sept/Nov robusta inverse (~$46/t) fails to validate arabica’s front-end tightness.
The rally is corrective on our count. KC sits in wave (iv) up within macro wave (C) lower; the expected path is a push to 295–300 followed by a wave (v) decline toward 215.
Base Case
Coffee stays tight nearby and looser forward, with the move now arabica-led.
September ~296c. Support 285c (prior resistance), then 267–270c; resistance 295–300c (Fibonacci confluence / wave-c of (iv) target), then 311c (delivery-thin July).
Bias this week: firm near-term, fade into strength. Respect squeeze risk while certified stocks sit at multi-year lows, but sell rallies toward 295–300c given the record Brazil crop and the corrective wave count.


