

Summary
Key Takeaways:
Cotton remains weather-driven, with Texas conditions continuing to shape price direction.
Coffee remains volatile as Brazil's delayed harvest and tight certified stocks support prices.
Technical analysis remains constructive for cotton, while coffee's outlook is improving.
Higher bond yields, elevated oil prices, and geopolitical tensions continue to pressure markets.
August's USDA WASDE and Brazil's harvest will be key catalysts for both cotton and coffee.
This week marks the first edition of our dedicated Sugar Market update, expanding our weekly commodity coverage.
Sugar remains range-bound as Brazil's strong crop and comfortable global supplies continue to cap prices, while below-average Indian monsoon rainfall remains the key weather risk to monitor.
Cotton
Cotton remains a weather-driven market, but deteriorating conditions in Texas have not yet produced a decisive breakout. U.S. squaring reached 81% and boll setting 45%, both near average. National good/excellent improved to 46%, and poor/very poor fell to 16%.
Texas remains the key risk: good/excellent held at just 34%, while poor/very poor fell to 24% from 28%. December cotton settled at 80.53 c/lb on 28 July.
USDA’s balance sheet continues to limit the upside, with U.S. production projected at 13.7m bales and ending stocks at 4.1m bales, or 29.5% of use. Export demand has slowed down, although sales rebounded to 51,300 RB, up 49% week on week.
Coffee
Brazil’s harvest reached 64%, still behind 77% last year and the five-year average of 70%. September arabica settled at 339.4c/lb, while robusta closed at US$3,877/t.
Large crop estimates remain bearish: 66.7m–75.4m bags. However, ICE arabica stocks have fallen to around 292,000 bags, keeping squeeze risk elevated. Potential El Niño-related losses of 15%–20% remain a risk scenario, not a confirmed outcome.
Global Macro
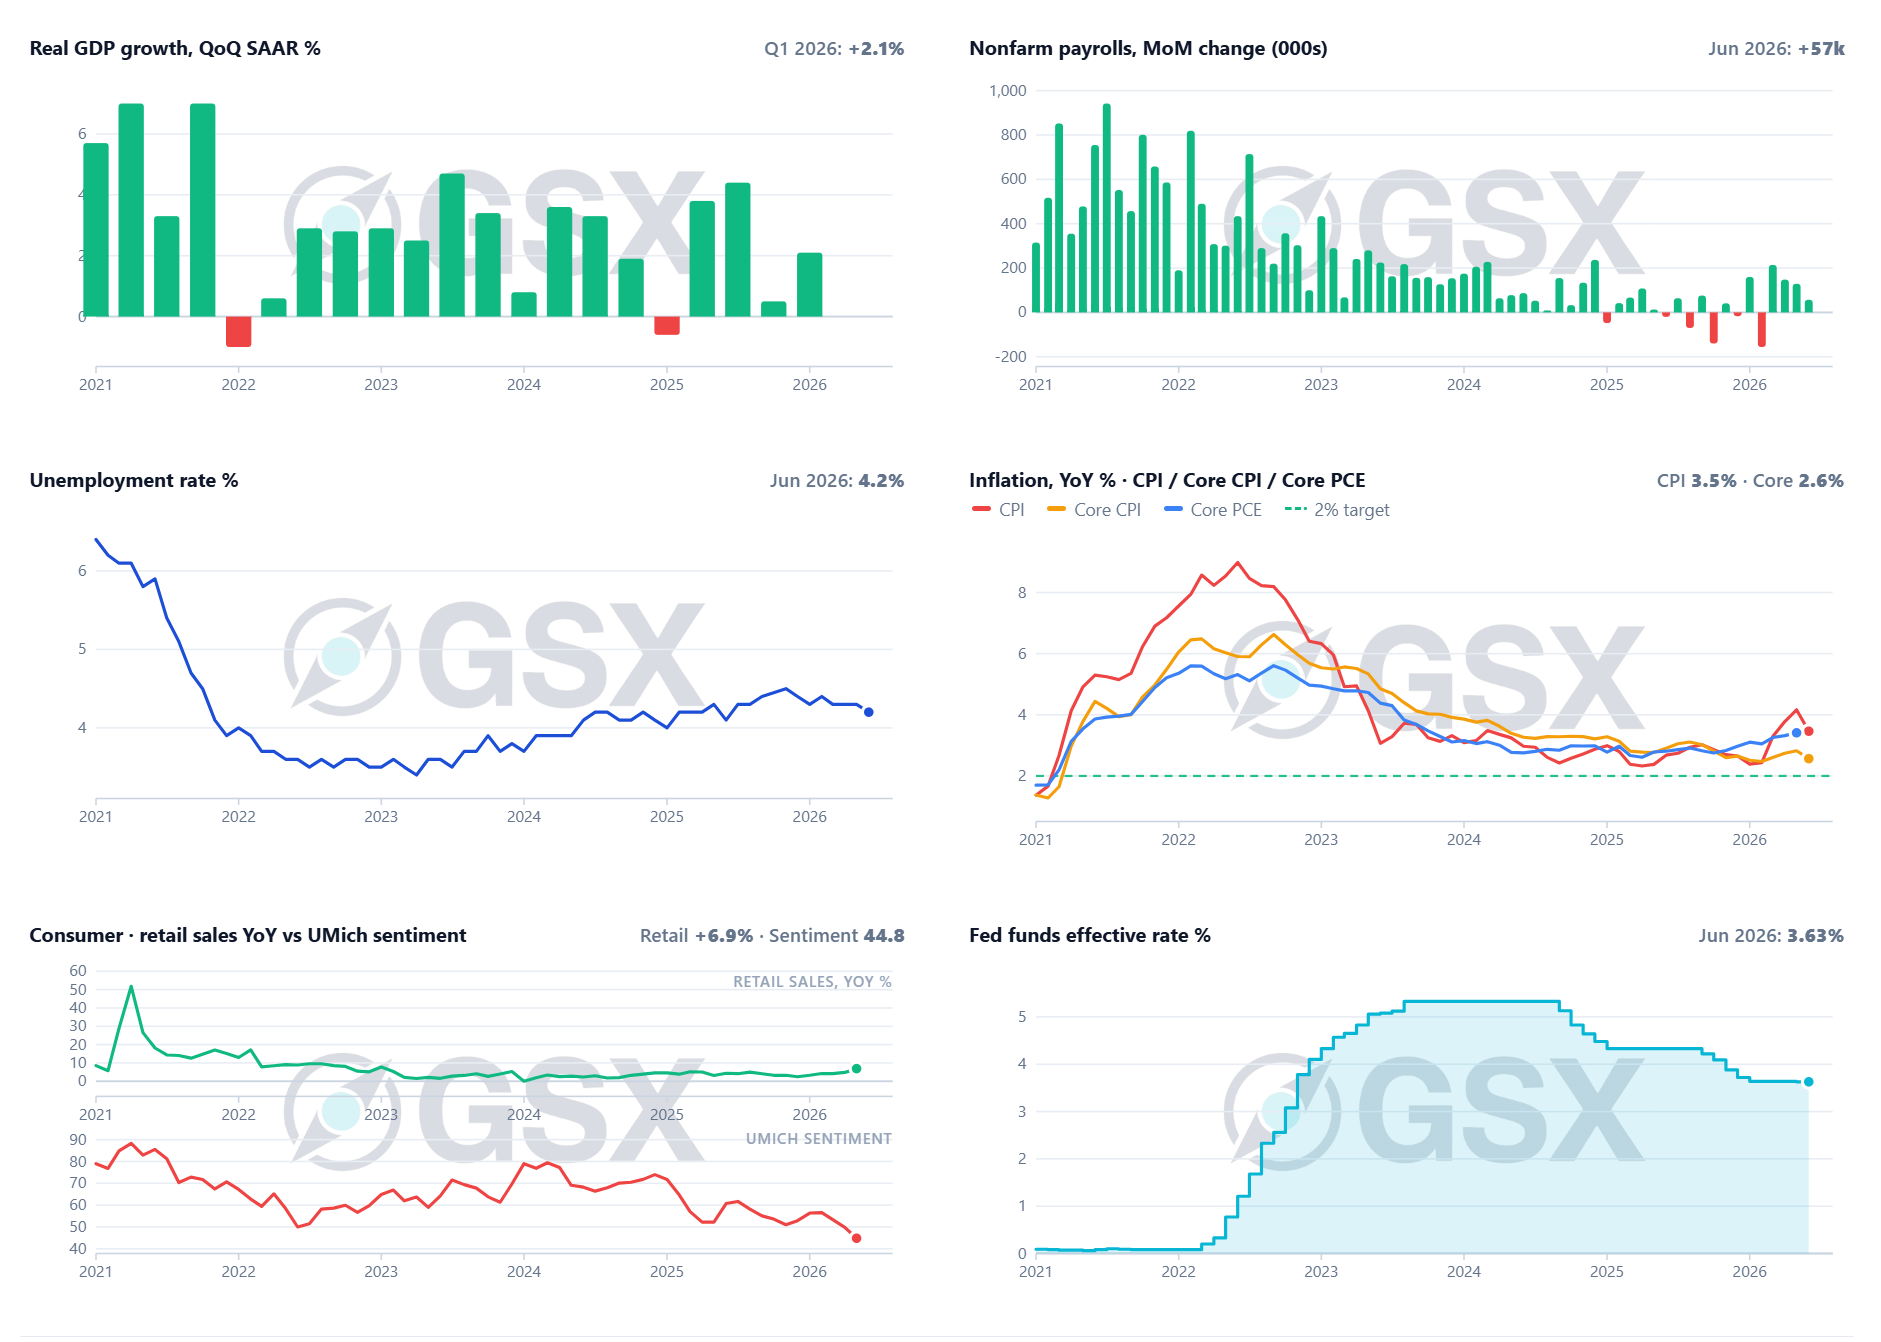
The global economy is shaping up to be a higher-for-longer, mildly stag flationary mix: economists raised 2026 inflation forecasts in 39 of 50 economies, while AI investment is helping hold expected global growth near 2.9% despite broad downgrades elsewhere. Across G10, the bias has shifted from coordinated easing toward holds or further tightening. The Fed decision overnight is unusually live, with markets pricing roughly a 33% chance of a 25bp hike, as renewed U.S.–Iran attacks lifted Brent about 3% to US$86.80/bbl and put energy inflation and Strait of Hormuz risk back at centre stage. Australia was today’s dovish exception: Q2 CPI slowed to 0.6% q/q and 4.0% y/y, while trimmed-mean inflation of 0.8% q/q and 3.6% y/y undershot the RBA, cutting the implied chance of an August hike to just 4%, although housing, rents and services inflation remain sticky.
Big Tech is now the critical test of whether AI revenue can catch accelerating capex: Microsoft and Meta report Wednesday, after Alphabet and Tesla’s negative free cash flow intensified the sell-off in chip and AI names. The major new NVDA–OpenAI development is that Nvidia is reportedly considering roughly US$250bn of financing guarantees for OpenAI’s planned 10GW Ohio data-centre lease, alongside possible financing of up to US$350bn of OpenAI’s Nvidia-chip purchases; the overall project could cost more than US$500bn, with an initial 800MW phase targeted for 2028.
Nvidia fell 5% on the report because it highlights the increasingly circular structure of the AI boom; a chip supplier potentially financing the customer purchasing its chips, although the project would also give OpenAI greater control over infrastructure currently rented from Microsoft, Amazon and Oracle. Meta is pursuing a similar external-financing model through its US$14bn, 1GW El Paso venture with BlackRock, including US$12.5bn of debt. The central market conclusion is that AI demand remains strong, but free cash flow, financing quality and returns on gigawatt-scale capacity now matter as much as how well now matter as much as the benchmark model performance.


Cotton
Cotton Price Action
ICE Cotton traded above 82 c/lb before closing 80.53 c/lb on Tuesday, 28 July. For perspective, 2026 year-to-date range is 59.06 - 85.27 c/lb, therefore the current price is only 4.74 cents below year-to-date high but 21.47 cents above the low, leaving it toward the upper end of the range. The five-year range is 59.06 - 153.76 c/lb, which positions current price toward the lower end. It is 73.23 cents below the five-year high and 21.47 cents above the low.
Dec 26 settled 80.53 c/lb, Oct 26 settled 79.21 c/lb, Mar 27 settled 82.11 c/lb, and May 27 at 83.24 c/lb. Against the 28 July closes that leaves Dec down 35 points and Mar down 36 points.
The July WASDE was mildly bearish, raising 2026/27 production to 13.70 million bales and ending stocks to 4.10 million, a 29.5% stocks-to-use ratio.
The seven-market spot average fell 58 points to 73.39 c/lb for the week ending 23 July. Transactions reported 2,299 bales, which is in comparison to 4,431 bales the same time a year ago. Crop ratings eased to 46% good/excellent from 45%, with 81% squaring and 45% setting bolls. Record heat across West Texas is the bullish lever, and certified stocks fell to 94,235 bales.
Technical Analysis
Strategic
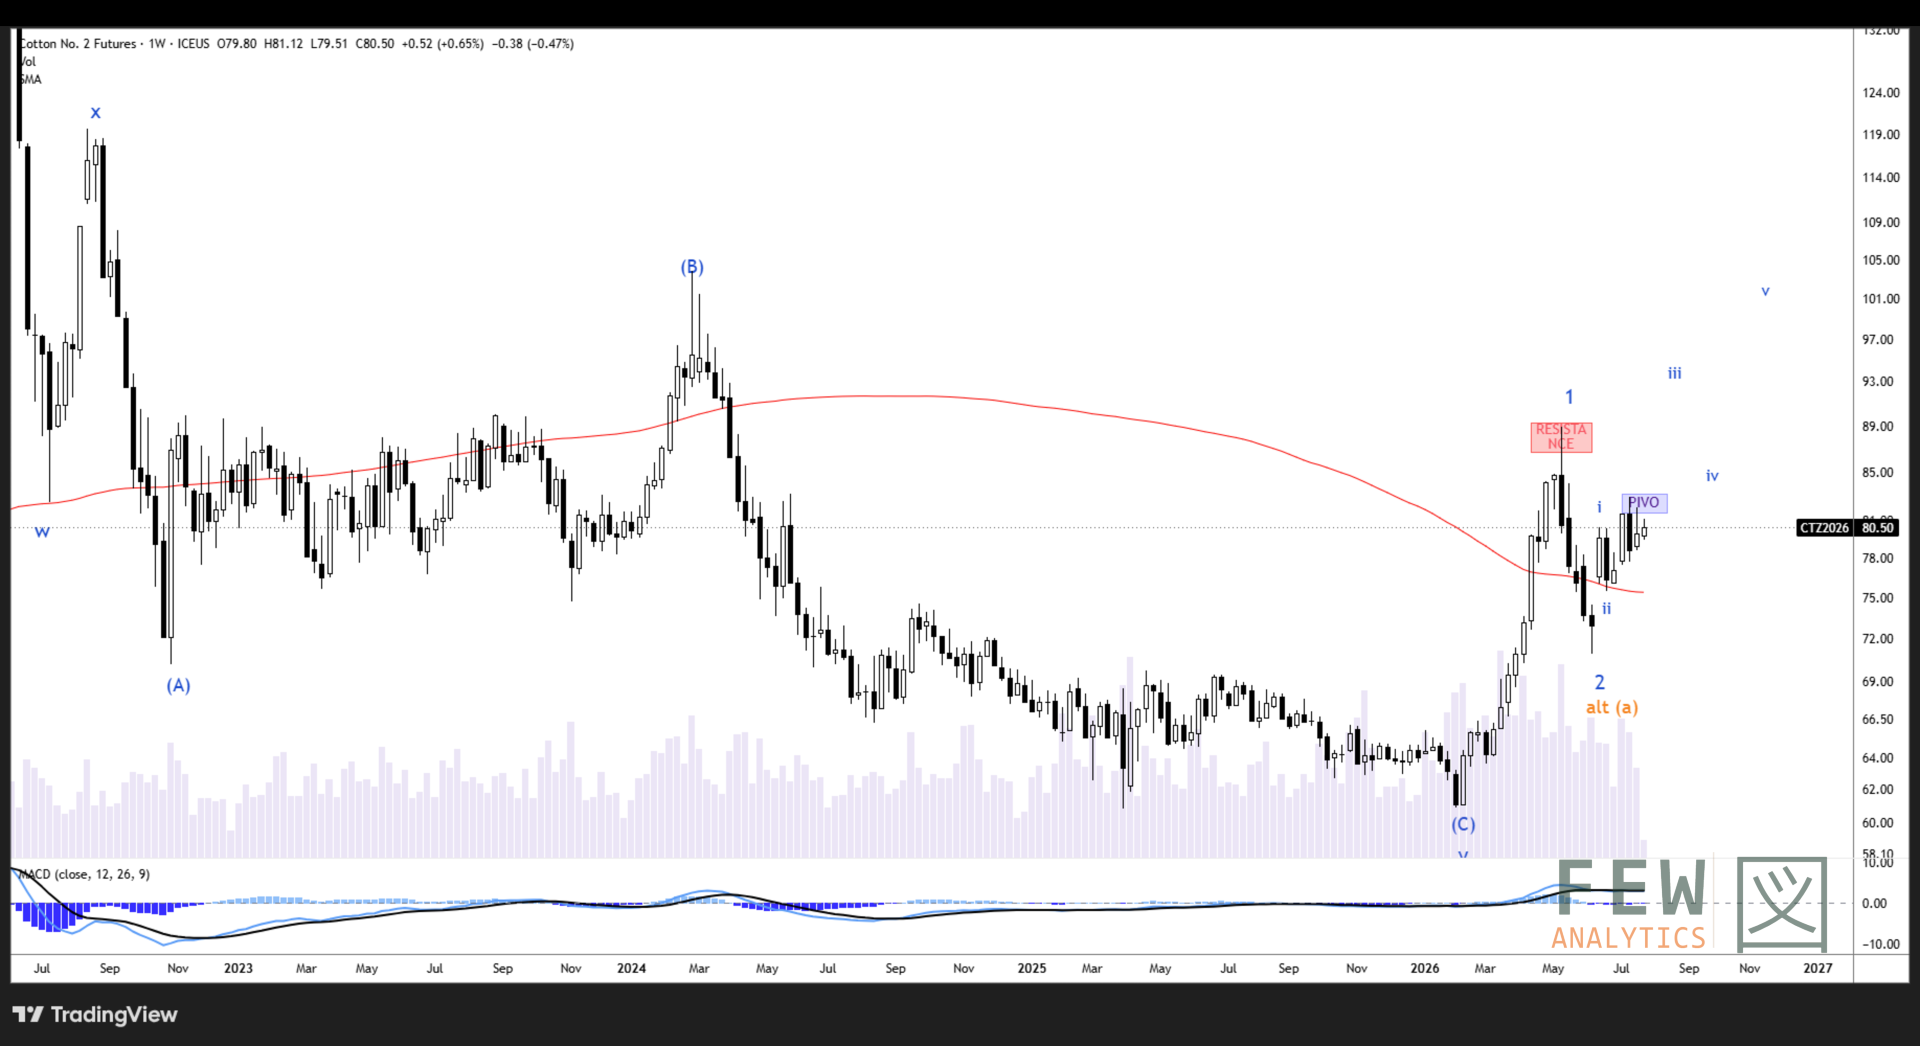
CT continues playing ball in the base case to print higher, above the May 2026 high. Still marching ever-upwards on the weekly chart, just contained by the Fibonacci extension pivot box at 81.5–83. Once the market clears that, we’d expect to see a new 2026 high in relatively short order.
Click to zoom
Tactical
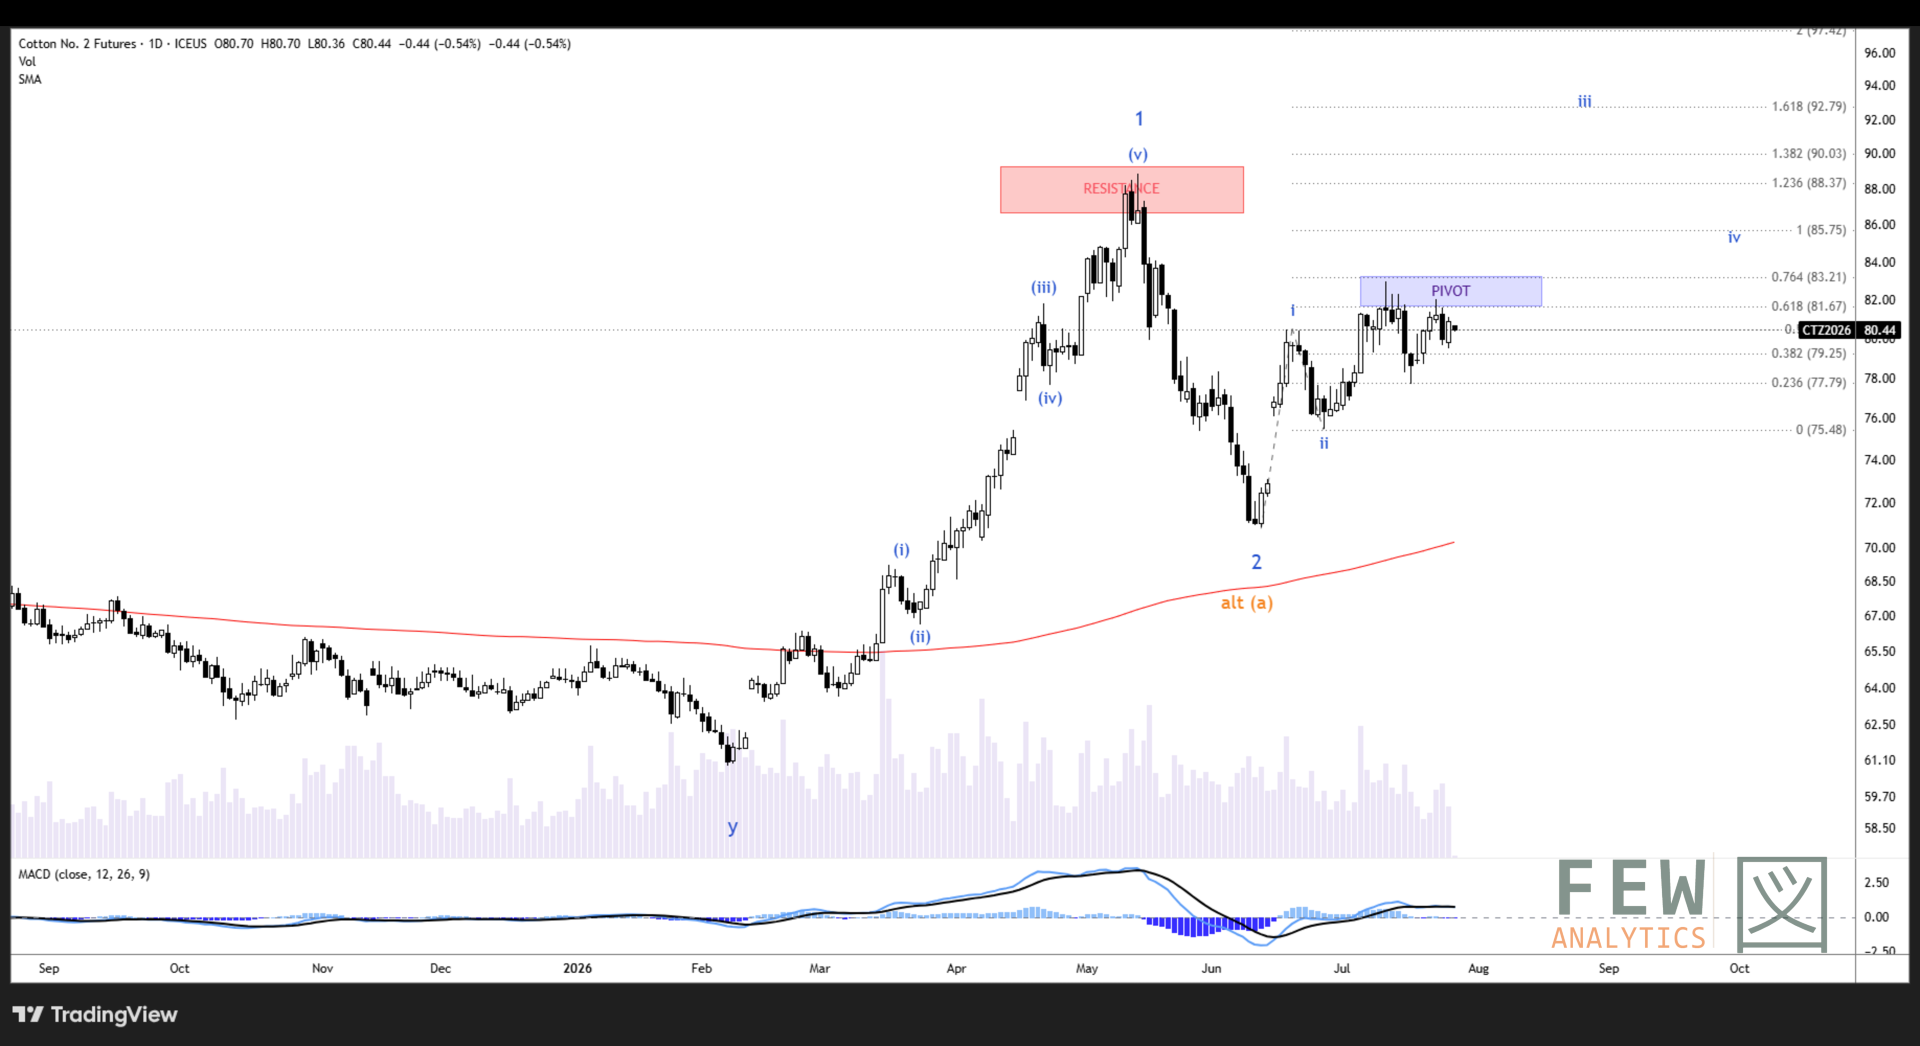
Last week, we were looking for higher in the short term on cotton futures, and the market delivered. However, it was not an impulsive move up as in five Elliott waves. Therefore, this week there is some risk of a small trip back to the mid-July lows around 78. Whether we see that or not,
we should really be breaking higher in the wave iii soon, targeting 92.
Click to zoom
Cotton Positioning
CFTC data for 21 July showed managed money accounts continue to increase their net long position to 53,209 contracts, an increase of 3,525 from 49,684 the prior week. Longs rose from 70,648 to 74,987 whereas shorts only rose from 20,964 to 21,778. Predominantly driven by additional longs of 4,339, with some addition of shorts, 814 contracts. Other Reportable continued to reduce their net long position from 54,053 to 47,150 over the past three weeks.
Commercials net position moved 1,717 contracts WoW, a decrease in net short from 130,625 to 128,908. Driven by a mix of long liquidation from 75,295 to 73,610 and a reduction in shorts from 205,920 to 202,518.
Open interest fell by 8,914 contracts to 448,035, sitting in the 97th percentile of its 20-year range, a level exceeded only 3% of the time.


Balance sheet
The 10 July WASDE remains the latest official read. For 2025/26, exports remain 12.20m bales, ending stocks 4.20m and the farm price 62.5c/lb. For 2026/27, production is 13.70m, ending stocks 4.10m, stocks-to-use 29.5% and the price forecast 73.0c/lb. The key assumptions remain 7.54m harvested acres and 872 lb/acre; Texas must underperform those assumptions to tighten the U.S. sheet.
Globally, production of 117.26m bales remains 4.69m below consumption of 121.95m, with ending stocks at 71.22m. The world balance is supportive, but the U.S. balance remains burdensome. The next major production update is 12 August.
Planting has progressed into squaring
Squaring reached 81% nationally, up from 73% and exactly equal to the five-year average. Texas reached 74%, up from 64%, but remained two points behind average.
Boll setting advanced to 45% nationally and 39% in Texas, both exactly in line with their five-year averages. Development remains broadly on schedule.

Condition Report
Crop ratings improved. U.S. cotton rose to 46% good/excellent, from 45%, while poor/very poor fell to 16%, from 18%.
Texas recorded the larger rebound: good/excellent increased to 34%, from 30%, while poor/very poor fell to 24%, from 28%. This partially reverses last week’s deterioration, although Texas conditions remain weak enough to keep yield risk alive.

US Cotton Export & Sales
For the week ended 16 July, current-crop upland sales rebounded 49% to 51,300 RB, while new-crop sales reached 16,100 RB. Upland shipments rose 29% to 276,300 RB. On a 480-lb statistical-bale basis, all-cotton shipments were approximately 292,800 bales, lifting cumulative exports to 11.445m, around 109,000 ahead of last year.

Total commitments increased to 12.871m bales, 671,000 above USDA’s 12.20m export forecast, but the shipment target remains challenging. Another 755,000 bales must move by 31 July, equivalent to roughly 352,000 per week, around 20% above the latest pace.

At the current pace, approximately 0.80m bales of unshipped old-crop sales are likely to roll into 2026/27. Combined with 2.702m already booked for new crop, opening commitments would be near 3.50m bales, or 28% of USDA’s 12.30m forecast. Our base case is a 100,000-bale August WASDE export cut to 12.10m, lifting new-crop beginning stocks to 4.30m and ending stocks to 4.20m. The adjustment is mildly bearish, although the August production revision remains the larger balance-sheet risk.

Soil moisture deteriorated sharply despite the improvement in cotton ratings. Texas topsoil rated short or very short increased to 60%, from 52%, while subsoil short or very short rose to 51%, from 49%.
National topsoil short or very short increased to 47%, from 41%, while subsoil rose to 45%, from 40%. This is the week’s clearest supportive weather signal and limits the comfort from better condition ratings.

The latest Drought Monitor remained constructive for Texas. D1–D4 drought declined to 22.1%, from 25.8%, while D2–D4 eased marginally to 8.7%, from 8.9%.
The broad drought picture continues to improve, but the map is valid through 21 July and therefore predates some of the deterioration captured in the latest soil-moisture report.

For 3–7 August, CPC favors above-normal temperatures across all Texas regions. Precipitation is near median in North and West Texas and above median in South Texas.
For 5–11 August, above-normal temperatures remain favored statewide, but precipitation is near median across North, South and West Texas. The heat risk remains, but the explicit dry signal has eased.

Cotton On-Call
No major outlier in the latest Cotton On-Call report: An increase of 435 contracts in the unfixed call sales and still heavy concentration in the unfixed call purchases with 43,116 contracts in the new-crop December 2026 contract.

Outlook for Cotton
Bull Case
Texas stress: good/excellent improved to 34%, with topsoil short/very short at 60%.
Commitments remain strong: 12.871m bales, about 671k above USDA’s export target.
Rain outlook is mixed: missed West Texas showers would keep abandonment risk elevated.
Bear Case
USDA raised supply: U.S. production increased to 13.7m bales and ending stocks to 4.1m.
Rain remains the key cap: verified High Plains coverage would quickly reduce the weather premium.
Demand is still soft: sales improved, but remain below recent averages; on-call positioning is not clearly bullish.
Base Case
Crop progress: U.S. 81% squared / 45% setting bolls; Texas 74% / 39%.
December near 80.53c: support 80.0/79.3c; resistance 81.5/83.0c.
Bias: neutral-to-firm. Constructive above 79.3–80.0c; bullish above 83c; bearish if rain verifies and December breaks 79.3c.
Coffee
Coffee Price Action
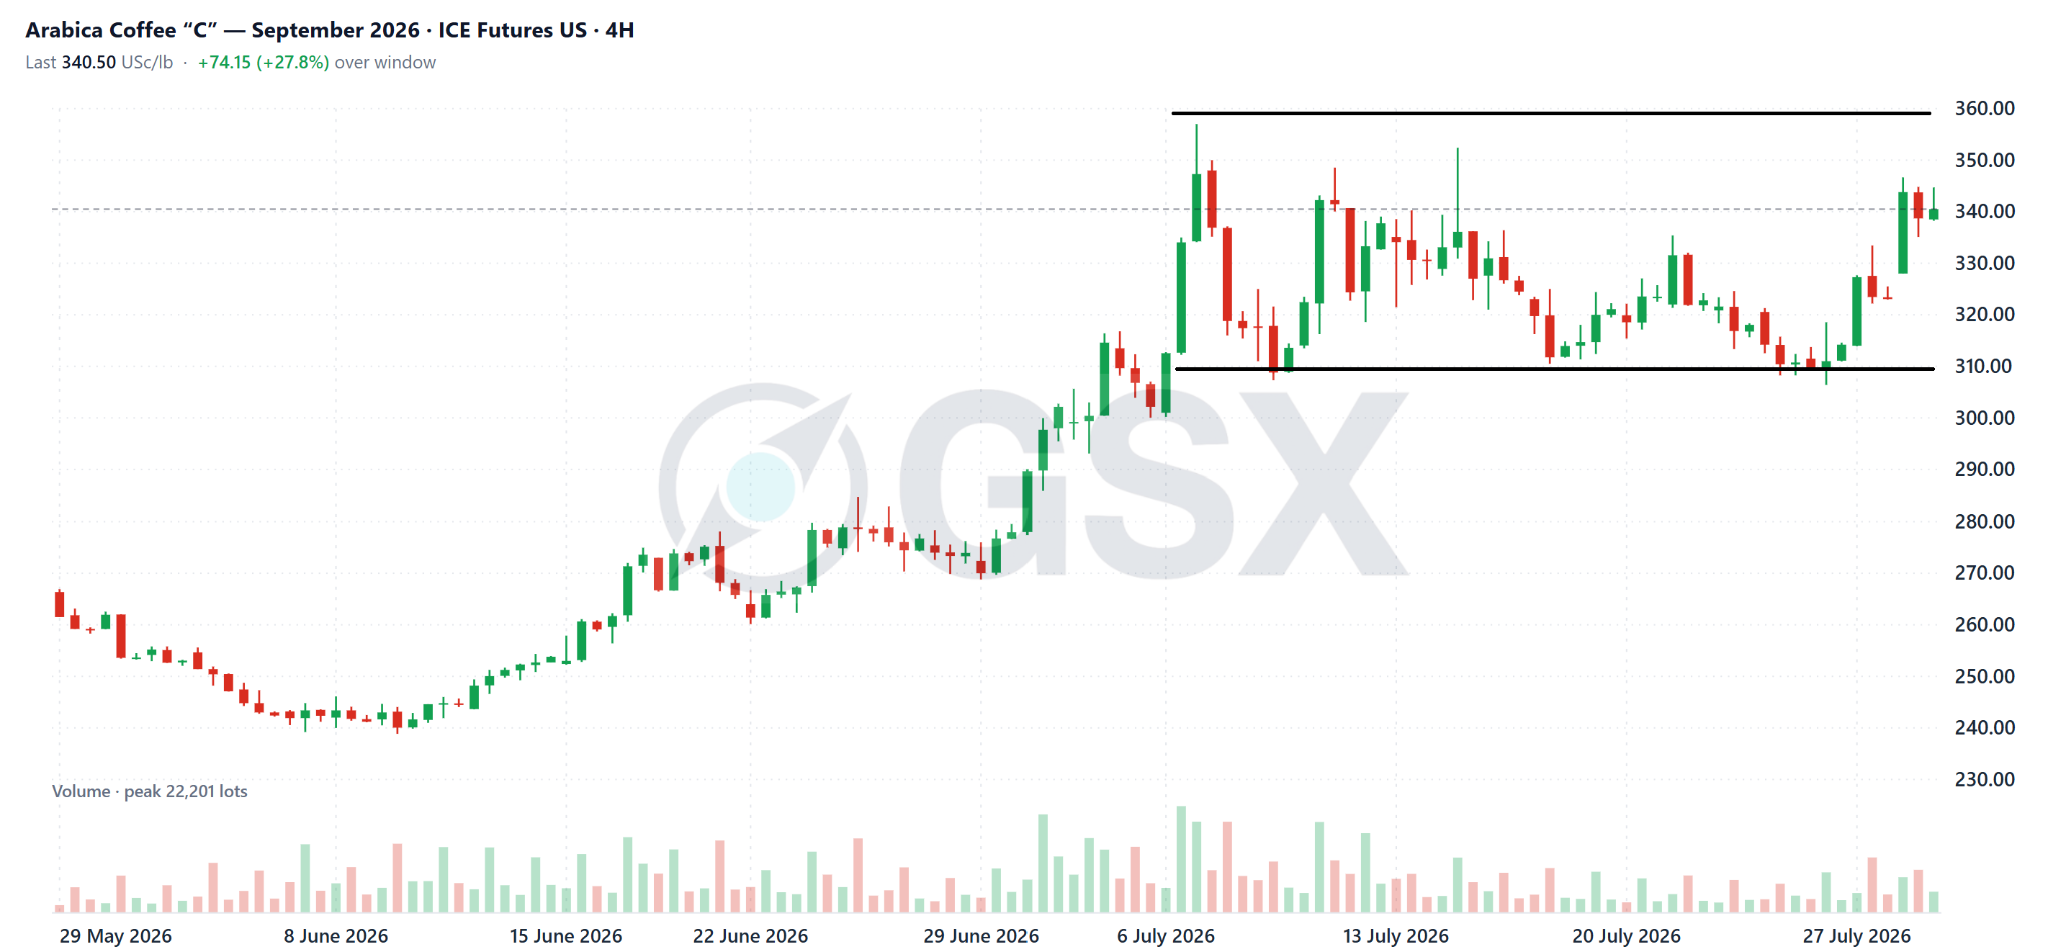
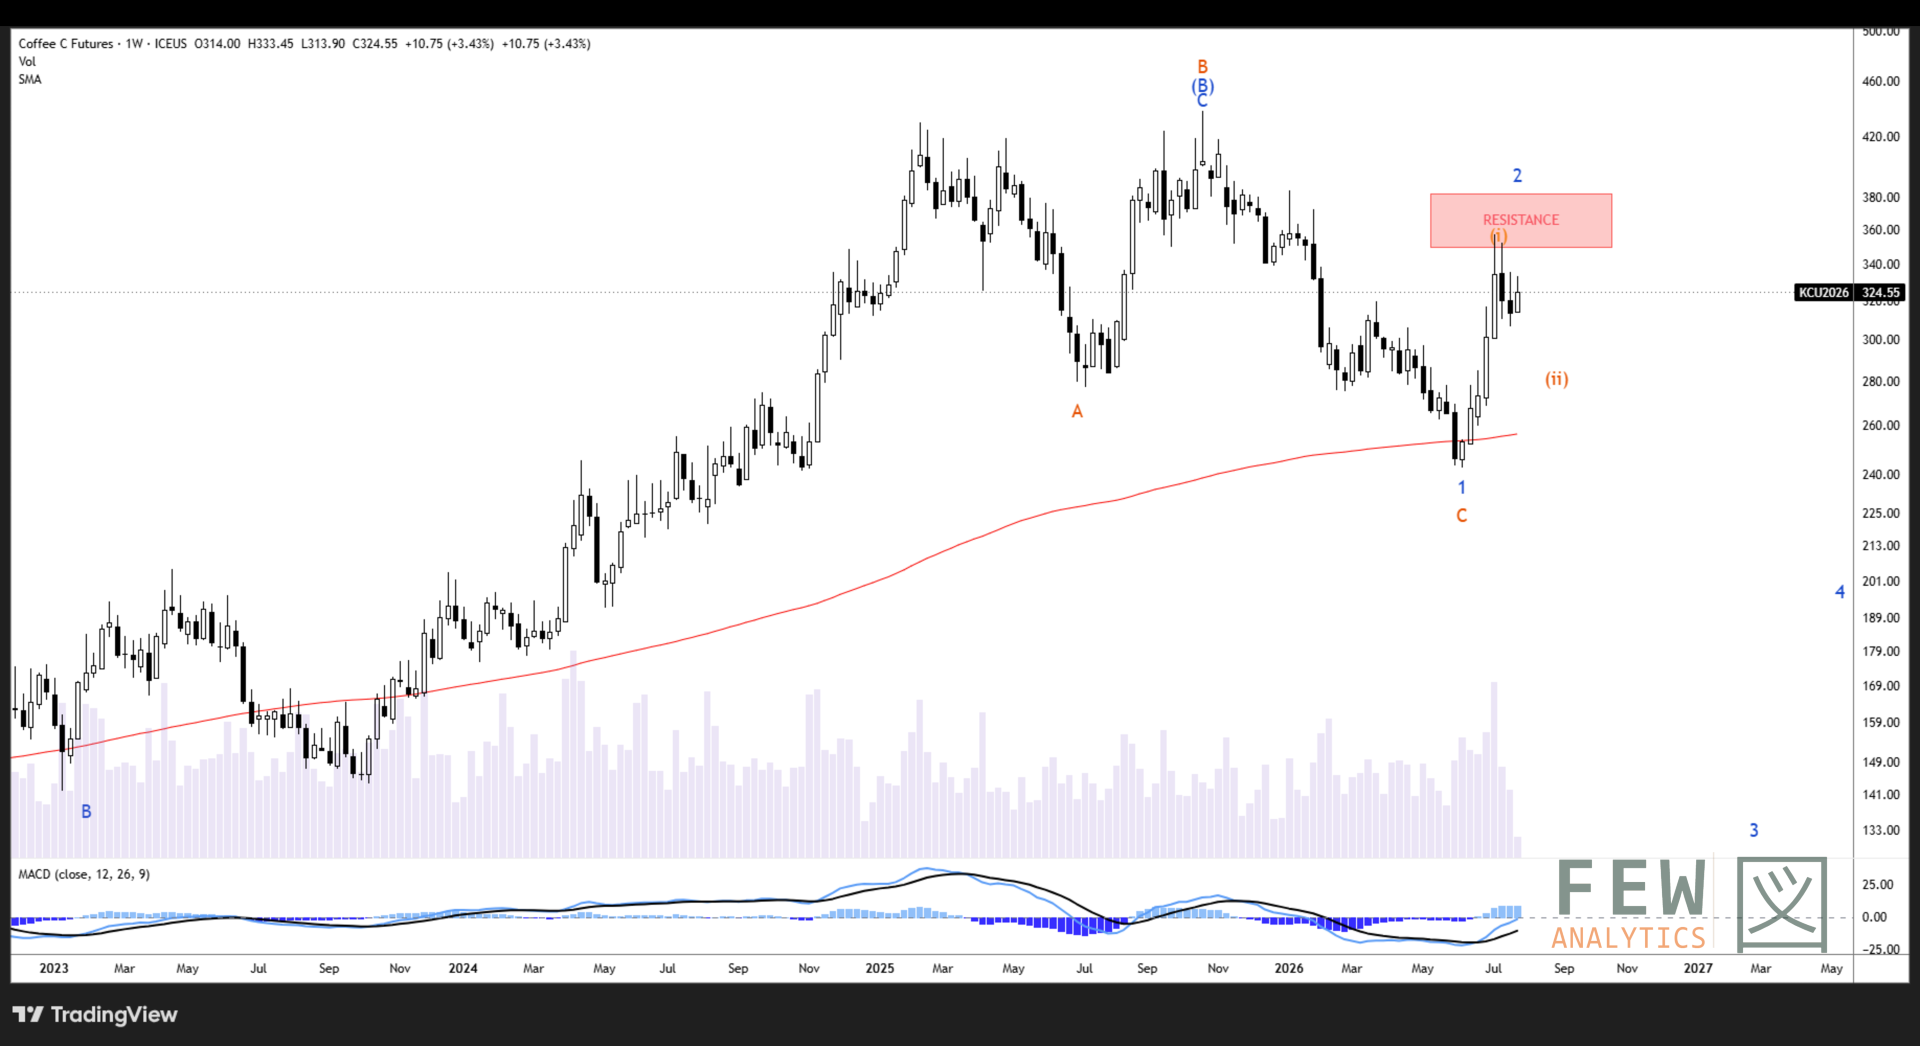
The market is trading off technical levels and is been driven fundamentally by weather forecasts from Brazil and by export numbers from Cecafe in Brazil. The range the market has established is 310 to 360, the market needs a fundamental catalyst to be able to break above or below this range.
Click to zoom
It would appear that the farmer in Brazil continues to hold the cards and are the natural long in the market by been well capitalized and continuing to sell in reasonable size. Additionally worries caused by the excessive rain having an effect on the quality of coffee is causing the market to stay evelvated compared to where it was at the beginning of June when the market bottomed out at 240. What is apparent is that certs continue to draw (now less than 300k certs on the board) and Brazil is not selling in size and the market believes this years crop is in doubt and that not even the following crop will be enough, this may be an exaggeration but it is what the market believe. Remember it is not the actual event but the forecast of events that move markets…..
Arabica Sept 26 settled on Tuesday, 28 July 339.4, Dec 26 at 317.3, leaving the U/Z spread at +22.1 c/lb, rose from +14.2 c/lb the prior week. Sep and Dec are the most active with Sep open interest at 59,949 and Dec at 58,173 lots.
Technical Analysis
Strategic
Another week of chop in the big-picture view for KC does not clear up the picture in this region. However, as previously discussed, this chop slightly reduces the probability of the bearish base case. If we are in a wave iii down, we should be heading lower in impulsive fashion; instead, we
are seeing the 300-350 ‘chopsolidation’, which favours the orange bullish case.
Click to zoom
Tactical
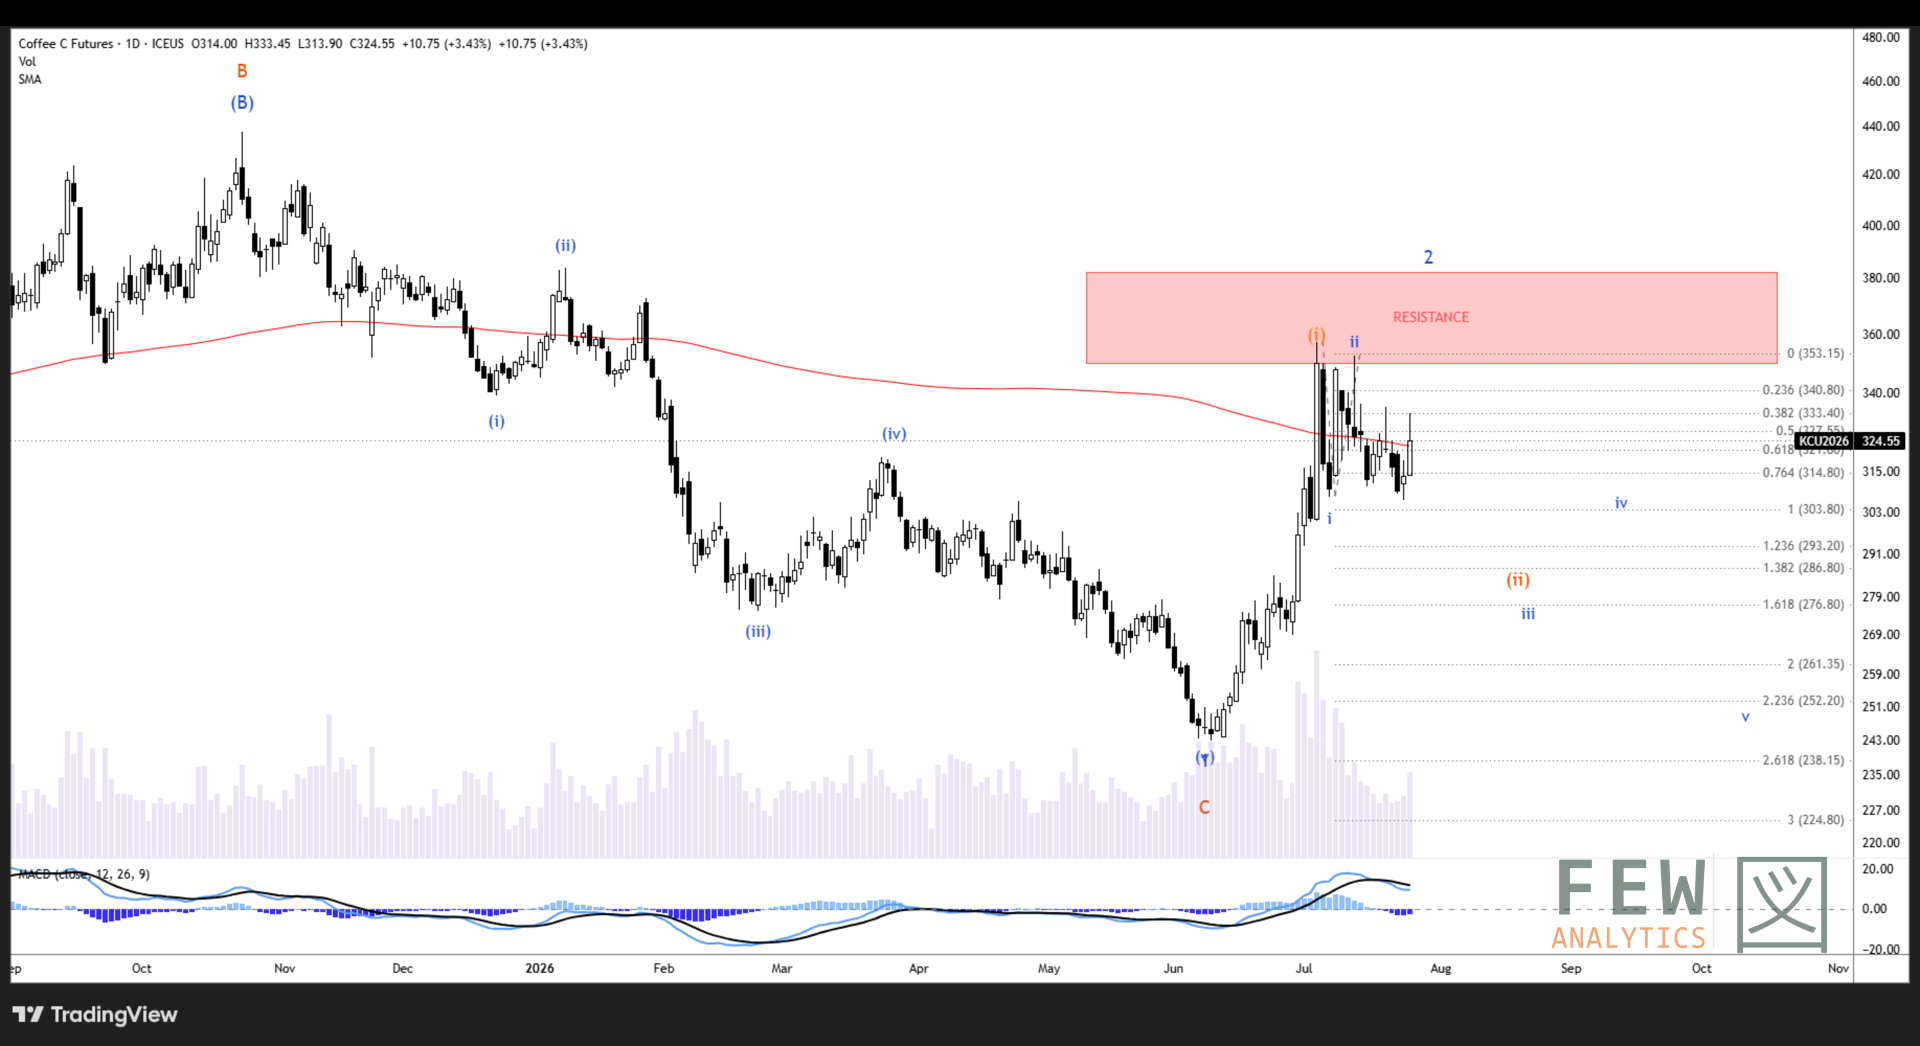
On the shorter timeframes, a micro five-wave move up is now evident off the 24 July low - the first real sign that something immediately bullish may be taking shape. Rather than looking lower, we now watch for a pullback to hold 306. This kind of confirmation would switch the bullish scenario to become our base case in KC Arabica.
Click to zoom
Physical Pricing


Certified stocks: Arabica at 292,810 bags as it continues to drop ~266,214 bags in the last 4 months, a 47.6% decrease, while Robusta remains steady currently around ~700k bags
Stock stored is heavily skewed in Antwerp (199,485 bags), and primary origin led by Honduras, then Peru. Latest aging concentrated in 181-210 days, with a long tail.


Coffee Positioning
Arabica’s fund position holds, with managed money net long 24,866, down only 101 from 24,967 the prior week. Longs fell from 38,431 to 37,892 and shorts fell from 13,464 to 13,026. Minimal change but a mix of long liquidation (-539) and short covering (-438).
Commercial accounts reduced their net short position from 27,599 to 27,355. Driven by a mix of long liquidation from 44,790 to 42,493 and short covering from 72,389 to 69,848.
Arabica open interest continues to decrease from 228,276 to 220,681, a 7,595 fall. By contrast, Robusta open interest continues to rise from 126,988 to 129,459, a 2,471 rise.


Outlook
Bull Case
ICE arabica stocks fell to 292,810 bags, a 2.25-year low; Sep/Dec backwardation widened to +22.1 c/lb.
Brazil’s harvest is only 64% complete versus 77% last year, with rain delays and cherry drop threatening prompt quality and availability.
Bear Case
Sep settled at 339.4c, down 1.44% Tuesday and 17.6c below the 357c spike; two ICE margin hikes and thin liquidity favour sharp reversals.
Brazil’s record crop remains the ceiling: USDA 71.9m bags; private estimates 66.7–75.4m bags.
Robusta is weak confirmation: stocks recovered to 4,237 lots, Vietnam H1 exports rose 7.3% to 1.05 MMT, and funds hold 42,414 net-long contracts.
Base Case
Tight nearby, looser forward—but now a high-volatility range rather than a clean breakout.
Sep near 339.4c: support 320–315c, then 310–300c; resistance 340–352c, then 357c.
Bias: fade rallies into 340–350c, but avoid chasing shorts below 315c while stocks remain under 300k bags and U/Z holds near +21.1c.
Sugar
Sugar Price Action
Raw sugar No. 11 traded sideways over the past month before closing at 14.55 c/lb on 28 July, down 0.33 cents from the previous Tuesday. Its 2026 year-to-date range is 13.36–15.75 c/lb, placing the current price 1.20 cents below the 2026 high and 1.19 cents above the low. However, the five-year picture is wider, as the current price is 13.42 cents below the five-year high of 27.97 c/lb and only 1.19 cents above the five-year low of 13.36 c/lb. Therefore, current prices remain near the bottom of their five-year historical range.
At Tuesday’s settlement, Oct ’26 settled at 14.55 c/lb, down 0.03 cents, while Mar ’27 settled at 15.41 c/lb, down 0.06 cents, leaving the V/H spread in 0.86 cents of carry, which reflects comfortable near-term physical supply. Open interest remains heavily concentrated in Oct ’26 at approximately 498,000 contracts, compared with approximately 301,000 contracts in Mar ’27. May ’27 settled at 15.23 c/lb and Jul ’27 at 15.24 c/lb, with both contracts down 0.08 cents. The forward curve corroborates this comfortable supply outlook, remaining in contango through Mar ’27 before stepping down into May ’27 and Jul ’27 in line with the seasonal new-crop structure.
The price reflects the strong 2026/27 crop coming out of Brazil and the market has not overreacted to the consensus view that El Nino will strengthen into December. Indian monsoon rains have been well below average, cumulative rainfall up to 28 July of 353 mm against normal of 419 mm, deficit of 16% from the long-period average. However, the deficit is concentrated in East and Northeast India (-30%), and South Peninsula (-28%), with Central India close to normal at -3%. The Indian cane belt extends from North through West-Central India and into the South, with the majority of cane produced in Uttar Pradesh (-24%), Maharashtra (-4%), and Karnataka (-25%). Important subregions were within the normal or excess rainfall categories, including West Uttar Pradesh (-13%), Madhya Maharashtra (+22%), and North Interior Karnataka (-13%). This may partly explain why prices have held within their range rather than breaking higher, as the core cane belt has not experienced severe deficits.
Sugar Positioning
CFTC data for 21 July showed managed money increase its net short to 96,596 contracts, a 2,003 rise from 94,593. Driven by a mix of long liquidation of 4,168 contracts to 184,494 and short covering of 2,165 contracts to 281,090 - MM appeared to react to the mid-week price dip, which reversed the following day.
Commercials held 249,407 longs and 387,763 shorts, leaving them net short 138,356, a reduction of 5,117 contracts. Driven by additional longs of 3,994, with some short covering of 1,123.
Open interest rose 12,217 to 1,192,719 contracts, and now sits at the 88th percentile of its 20-year history, placing participation toward the upper end. Interestingly, managed money has a contrasting view to other reportable. Funds net short 96,596 and other reportable positioned net long 49,100 contracts.


Sugar-Ethanol Parity
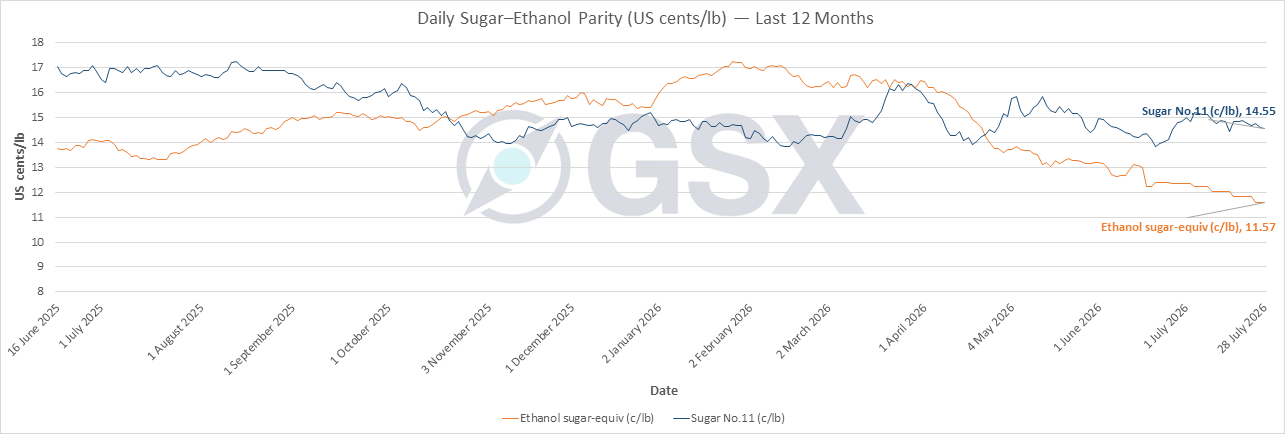
The daily parity model shows sugar favoured, at 14.55 c/lb against the equivalent sugar-ethanol price of 11.57 c/lb, a premium of 2.98 c/lb. Mill’s latest Hydrous ethanol price is 0.4091 US$/litre, a weekly change of -2.22%, as it continues to decline over the last month (month change of -6.36%). The accumulated sugar-ethanol production mix reported by UNICA was 41:59 through 1 June.
As long as the parity gap persists, USD/BRL holds steady or rises, mills may have a stronger incentive to allocate more cane toward sugar. However, Brent crude above US$87/barrel may partly offset this incentive by supporting ethanol economics with a lag. The next UNICA report could therefore show to shift toward a higher sugar mix if the parity advantage remains dominant, although such a reversal is not yet assured.
Click to zoom


